Predicted Medium Vote Thermal Comfort Analysis Applying Energy Simulations with Phase Change Materials for Very Hot-Humid Climates in Social Housing in Ecuador

 , ,
, ,  , and
, and
Abstract
:1. Introduction
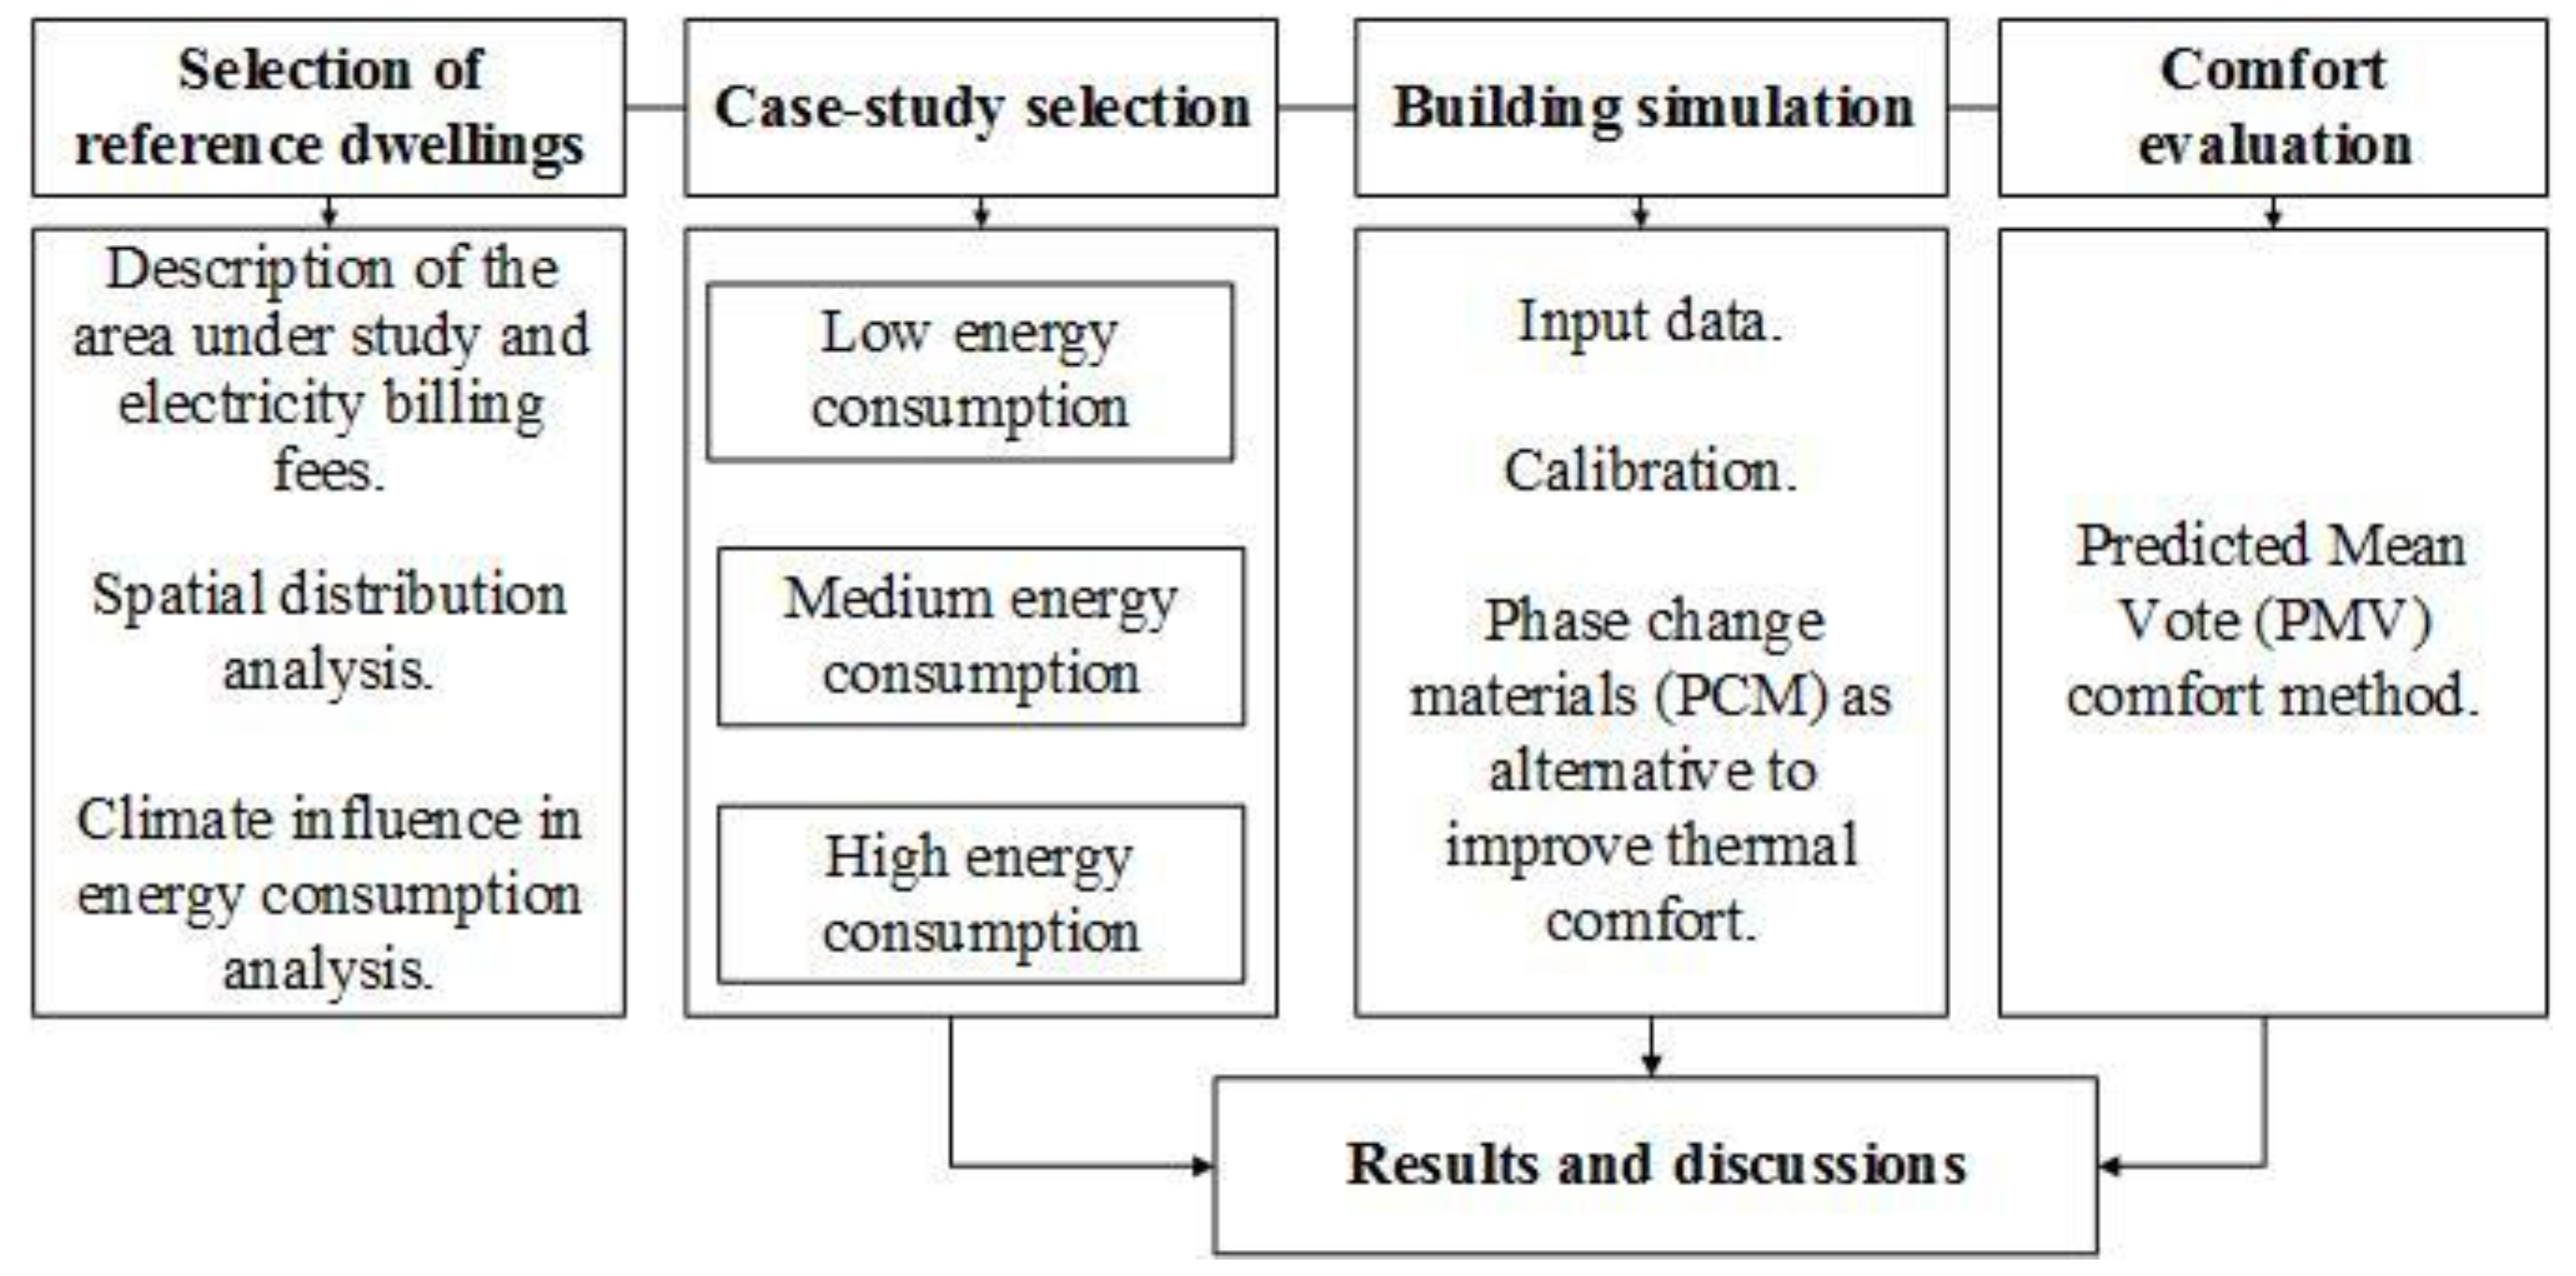
2. Materials and Methods
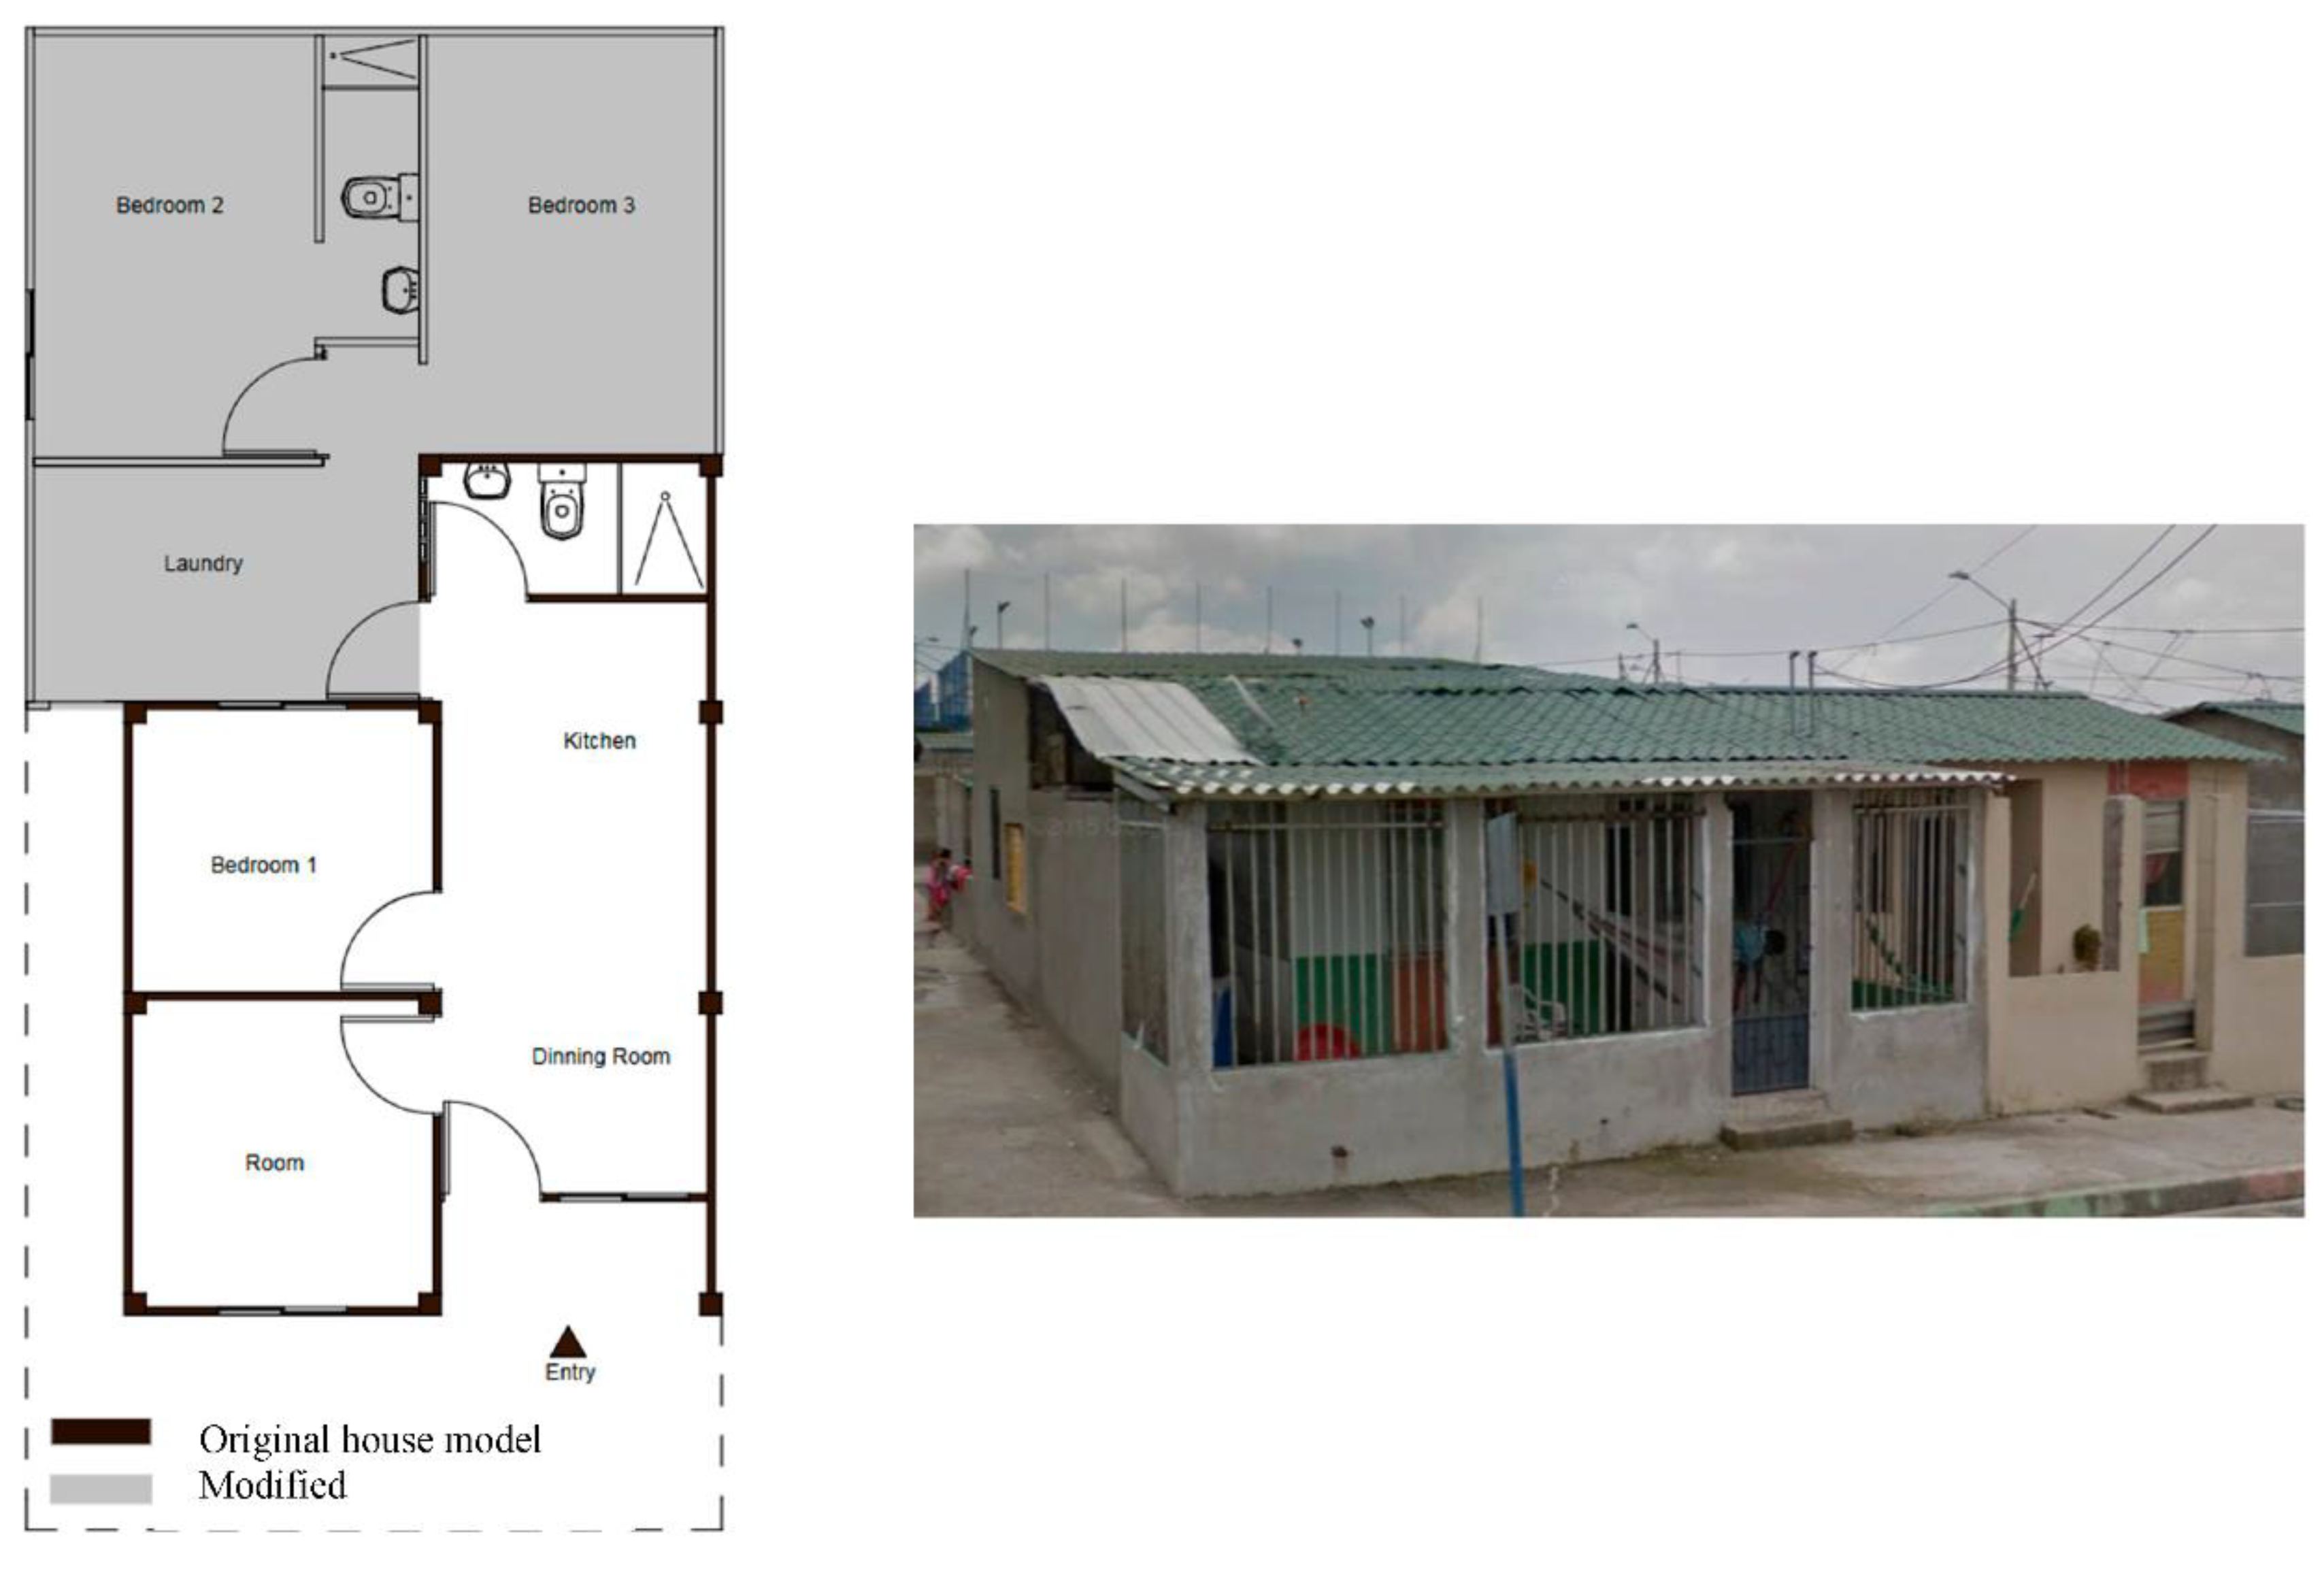
2.1. Selection of Reference Dwellings
2.1.1. Description of the Area under Study and Electricity Billing Fees
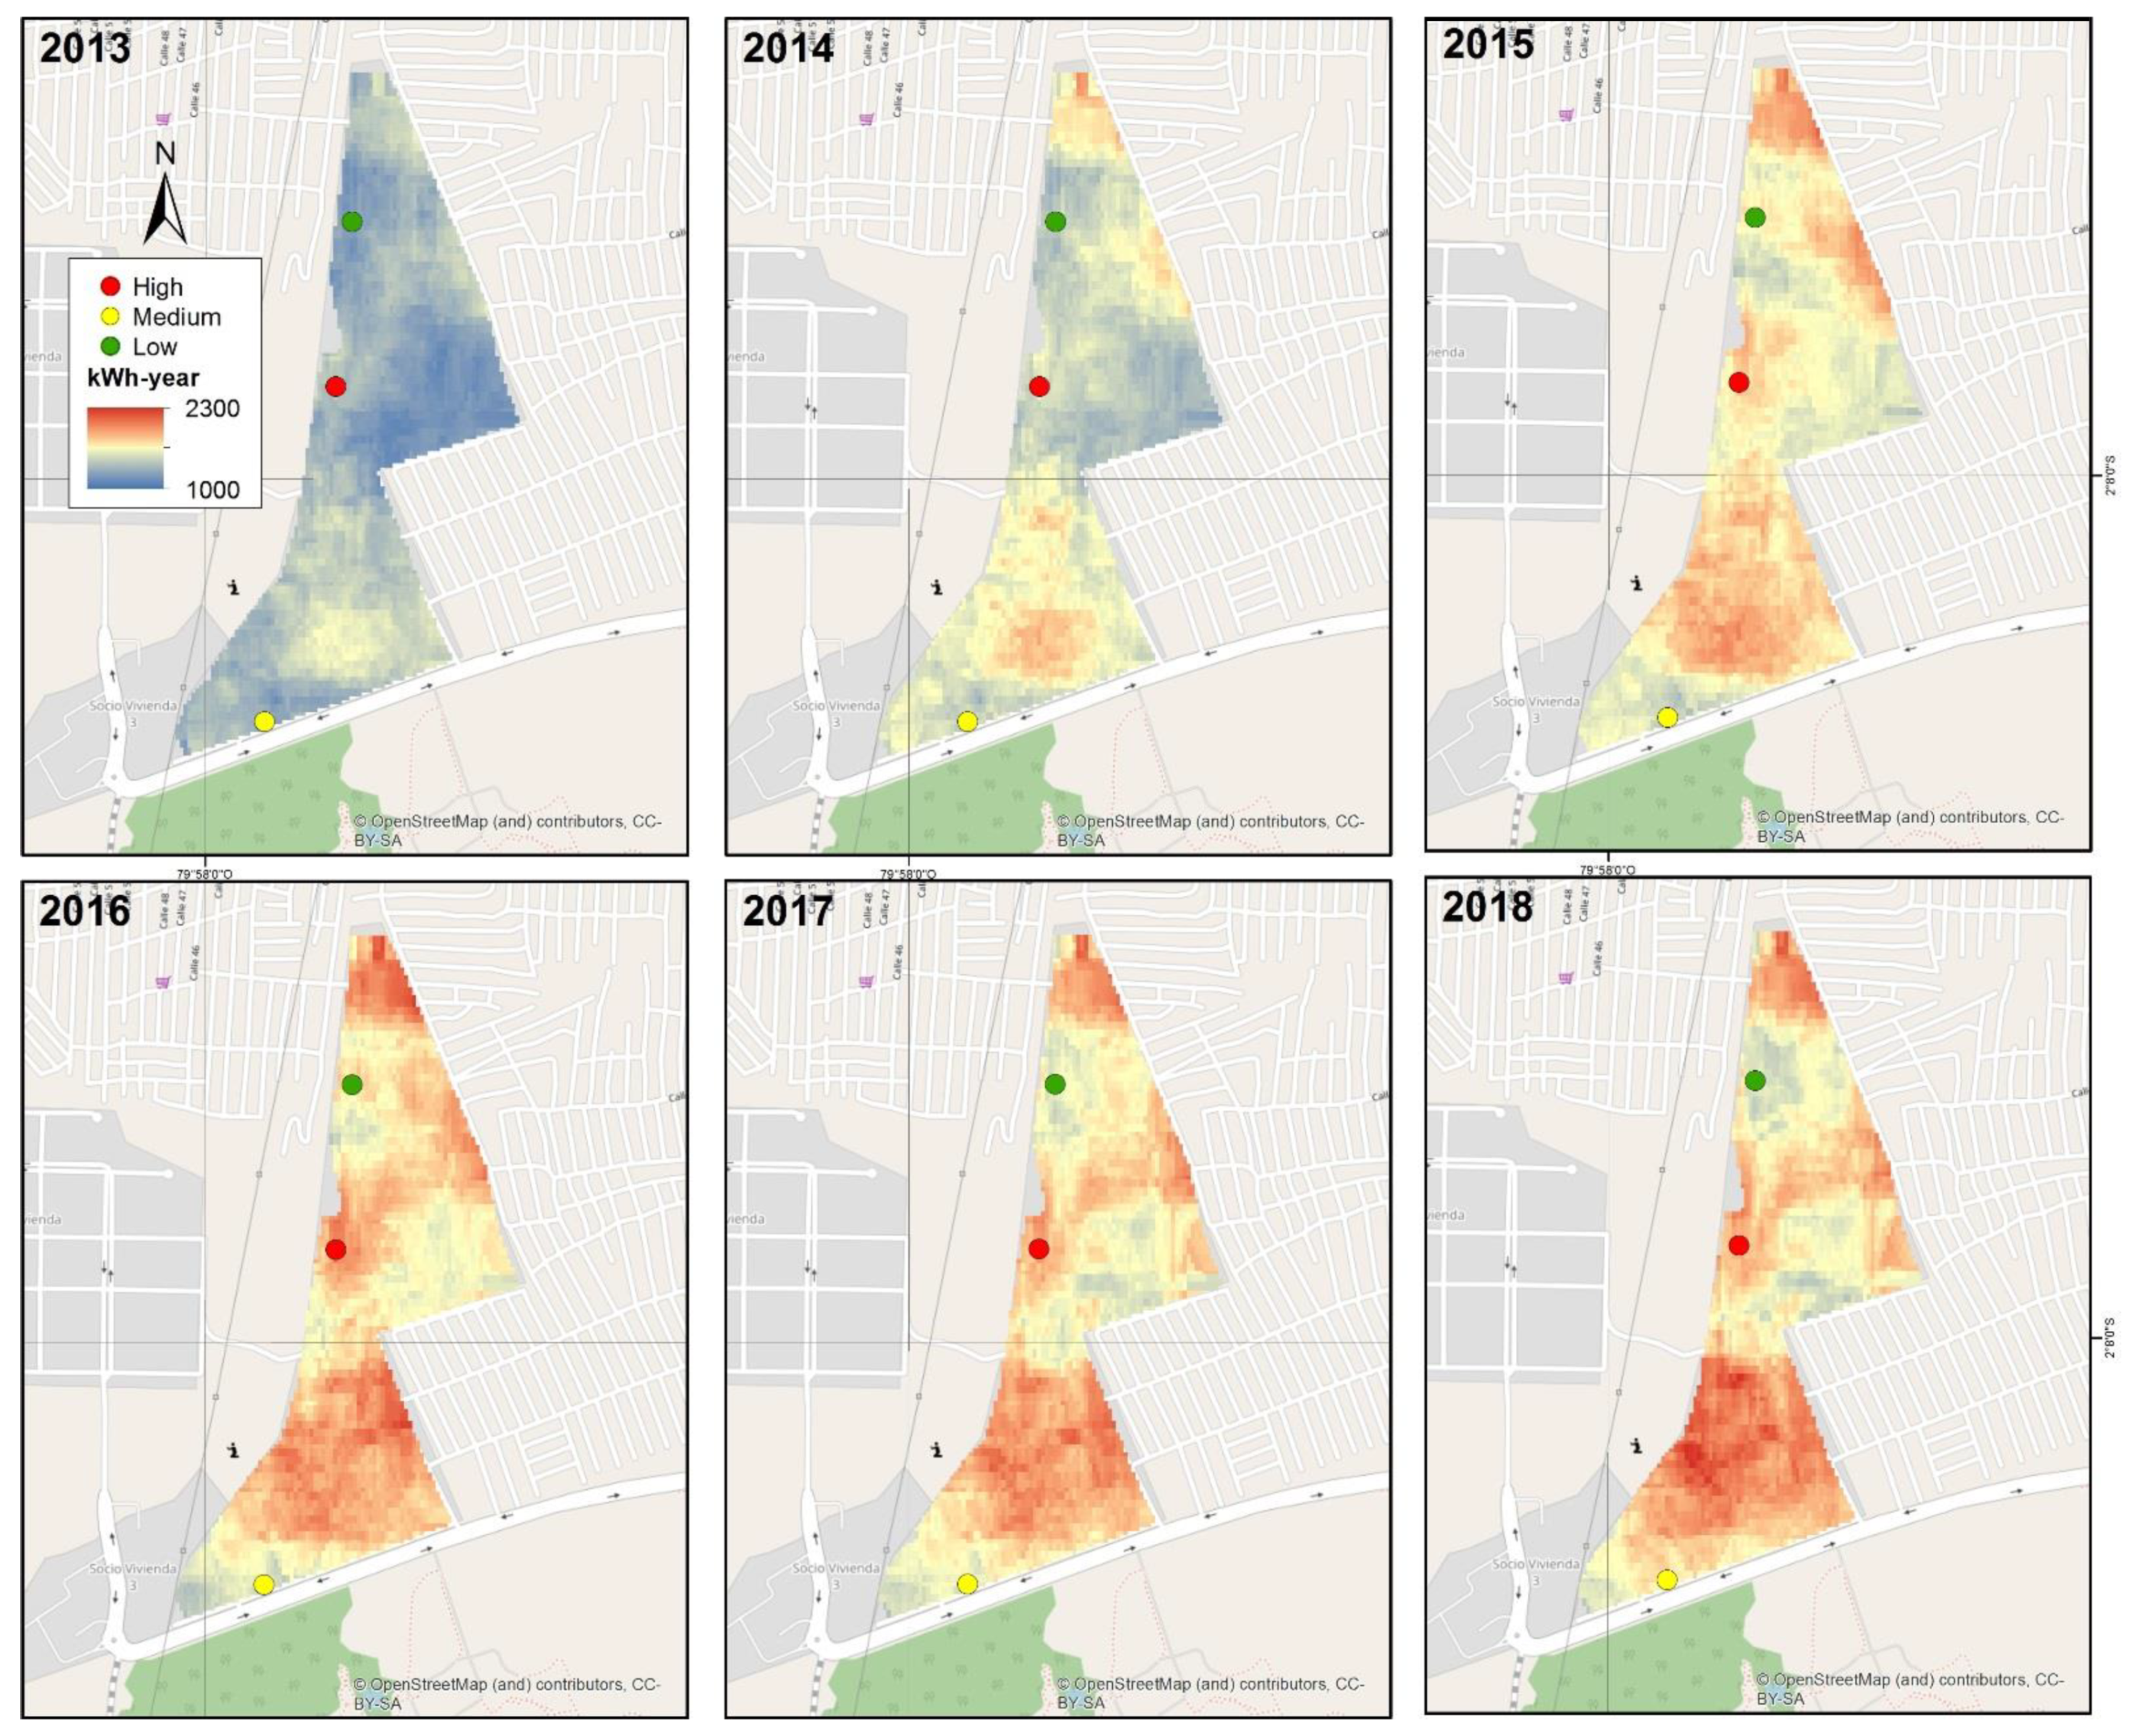
2.1.2. Spatial Distribution Analysis
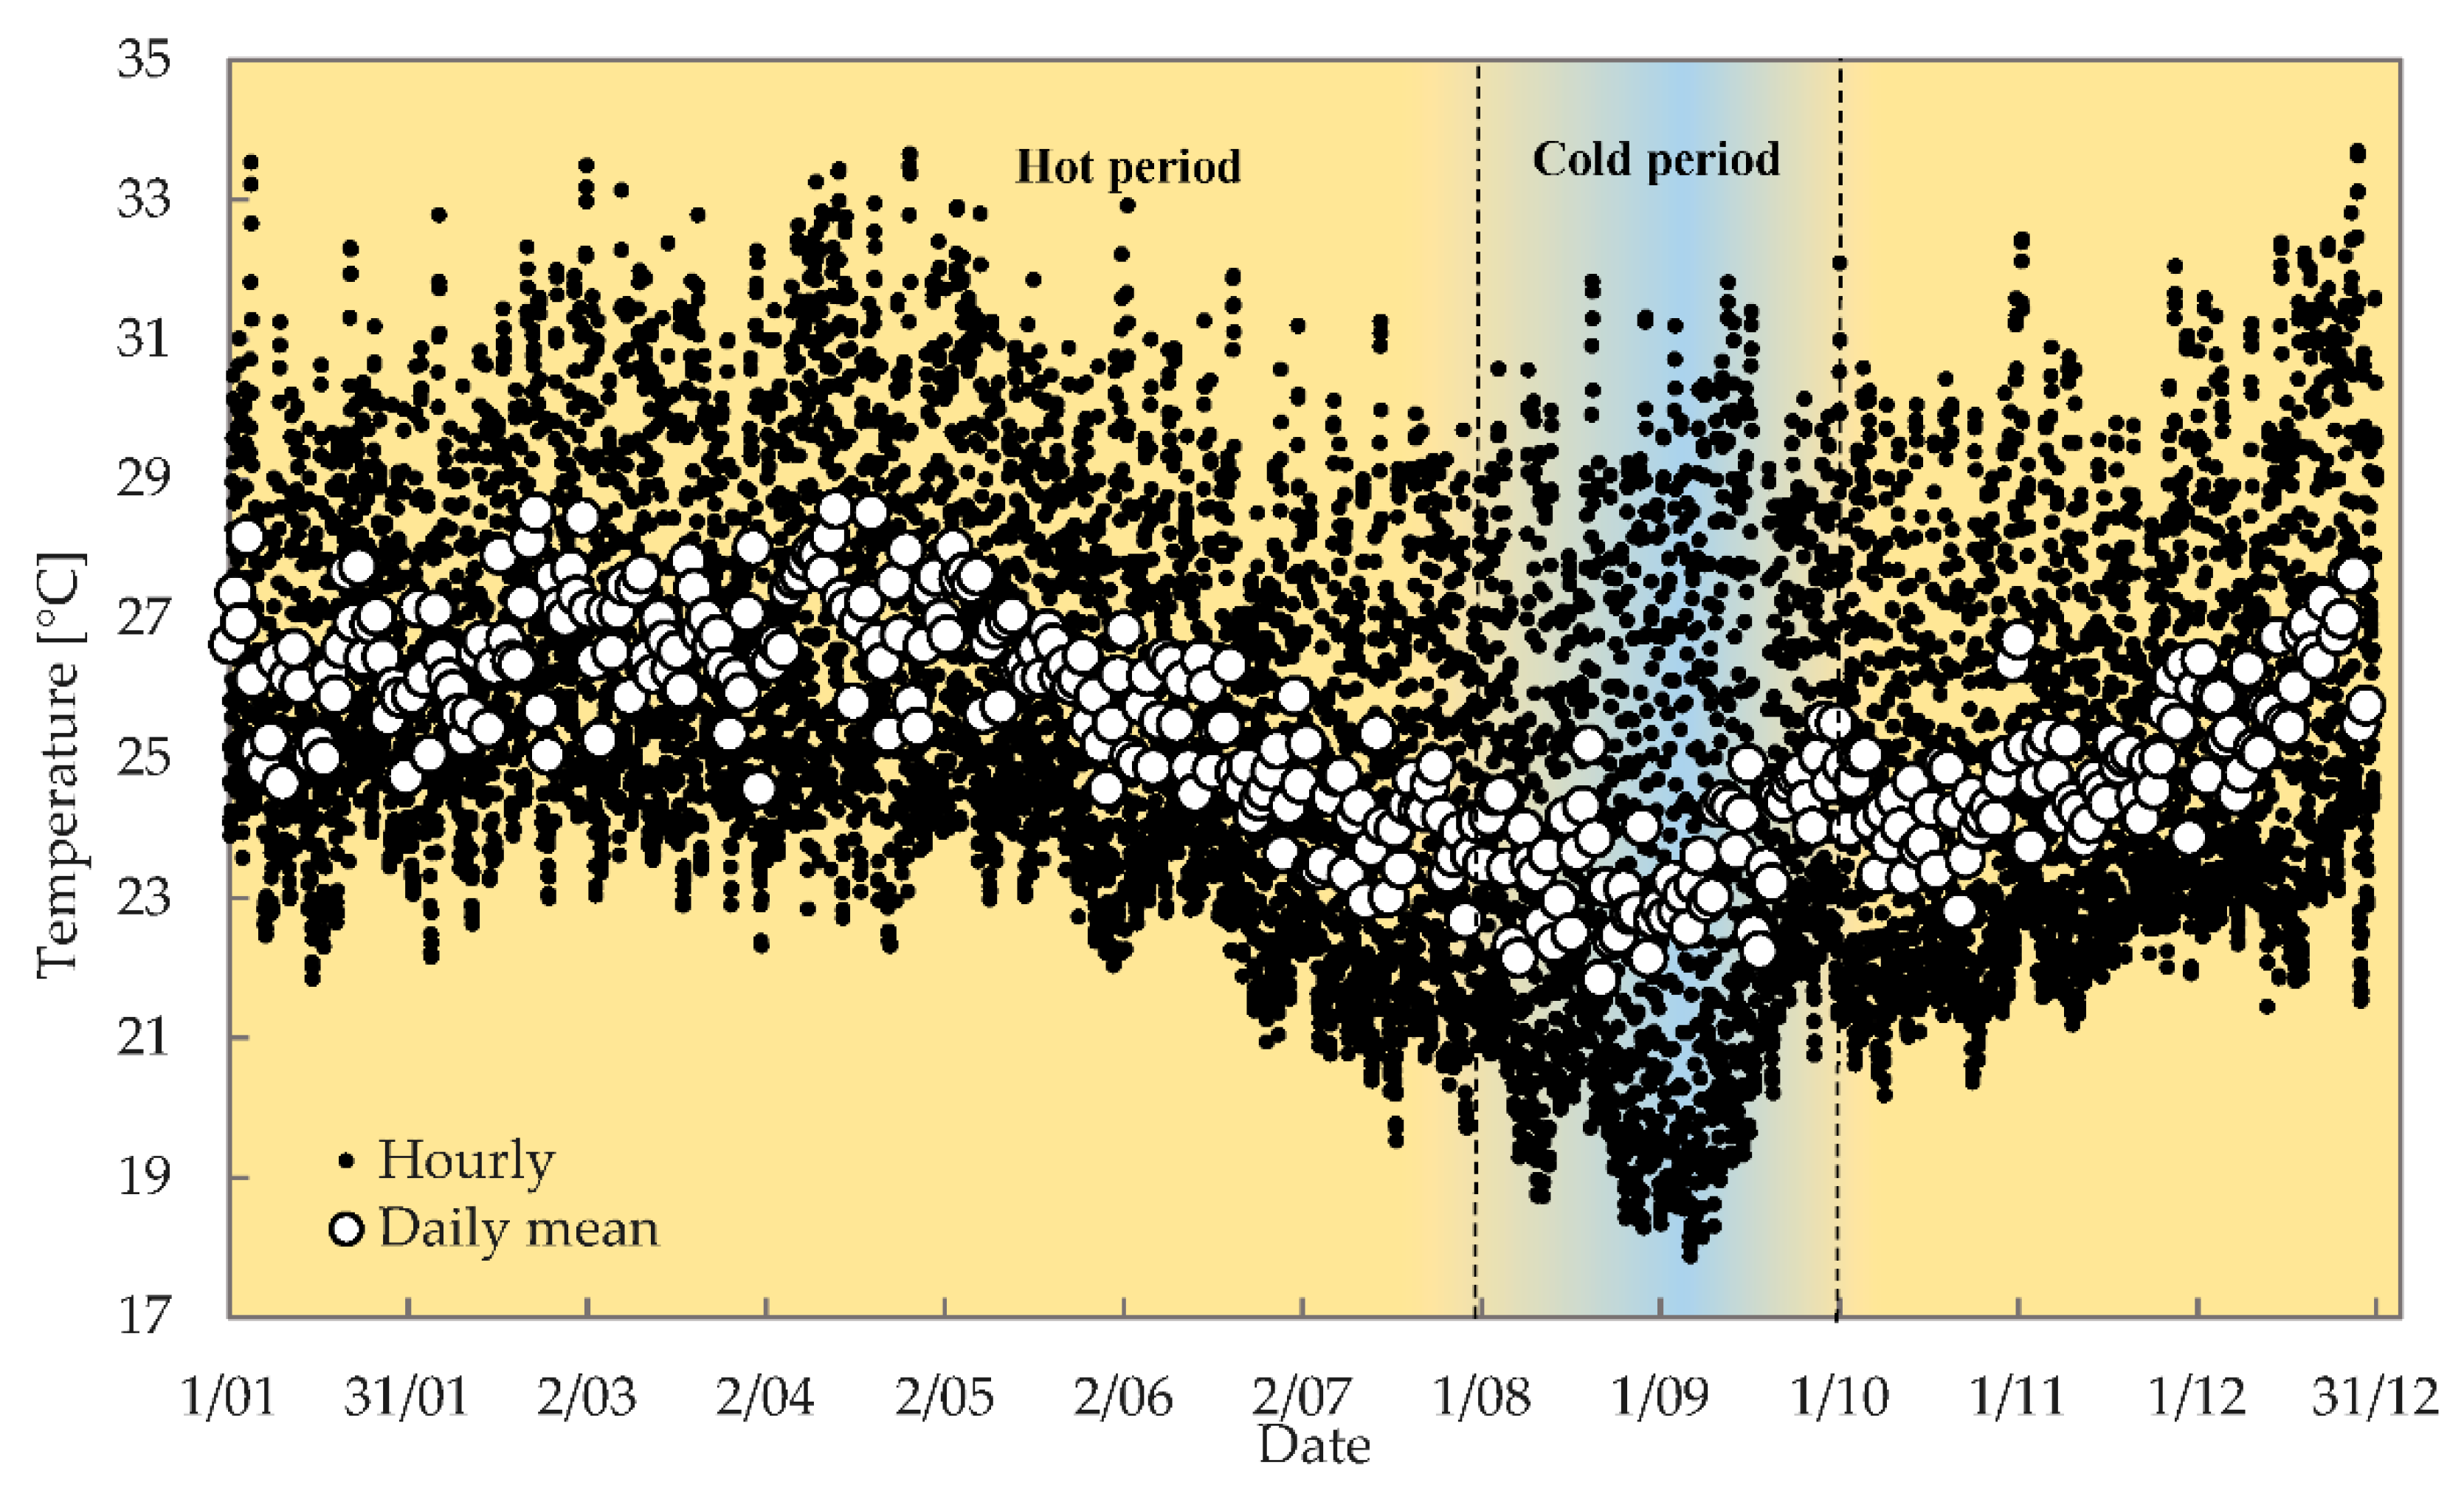
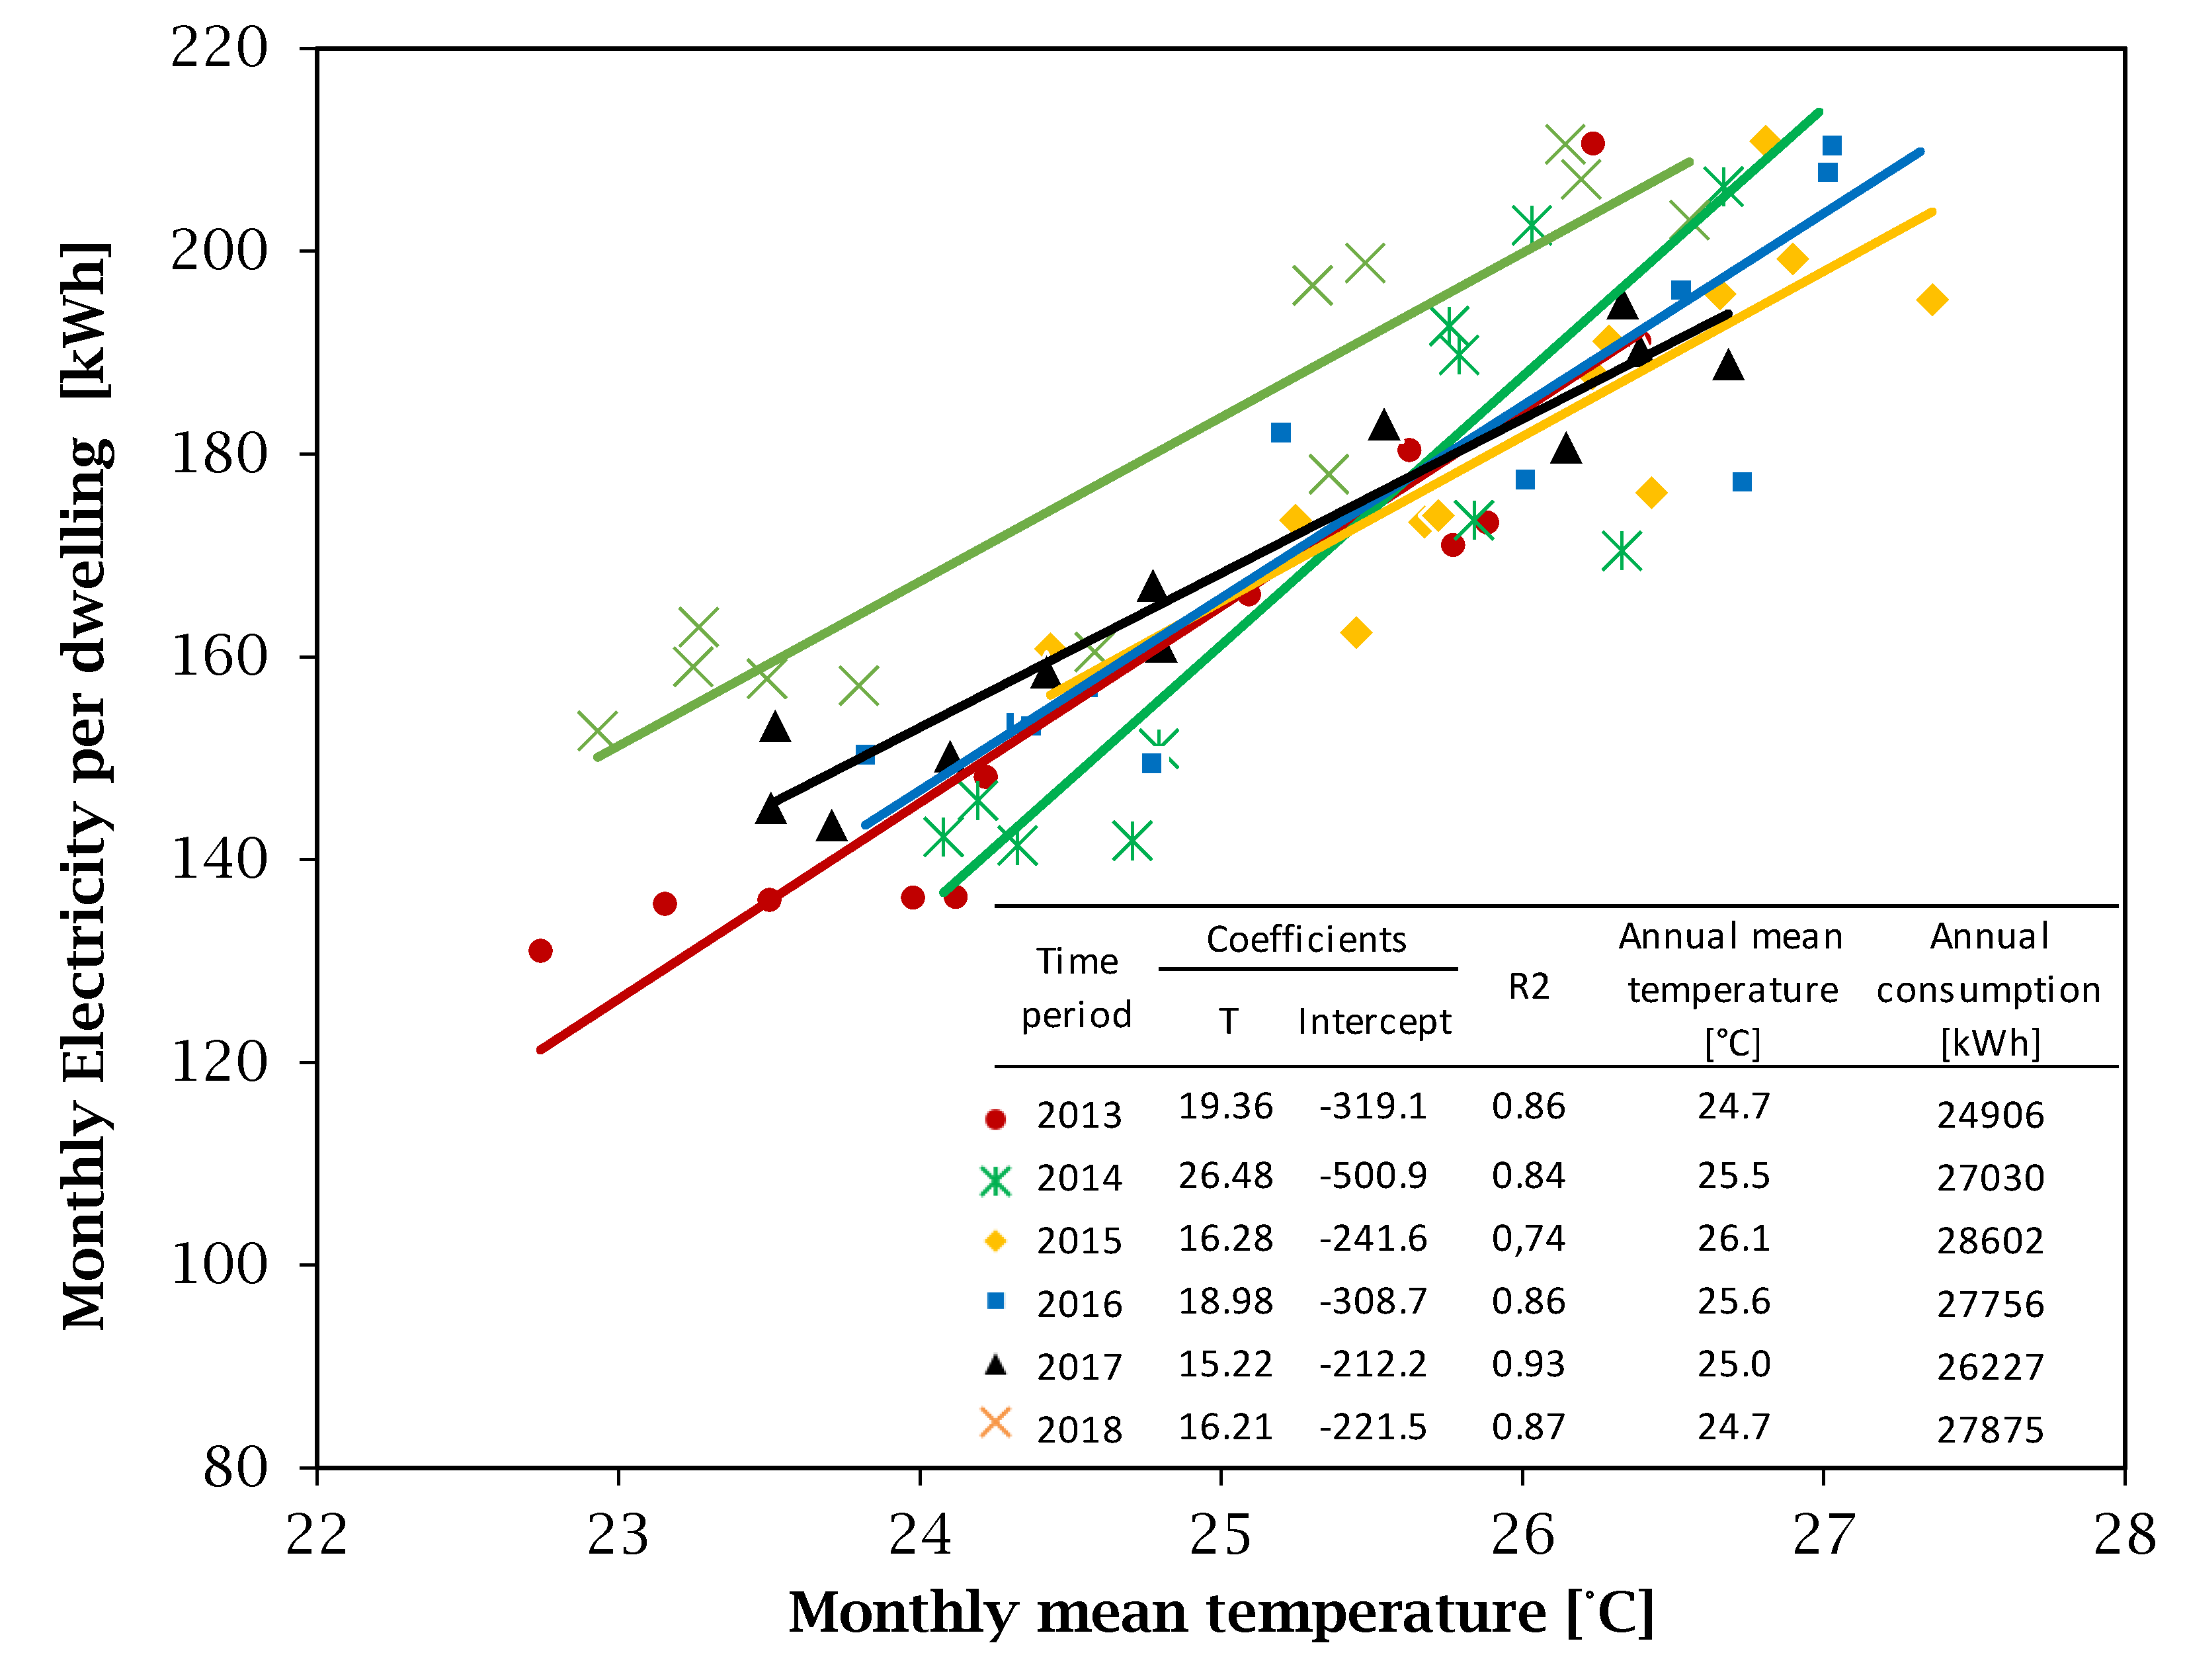
2.1.3. Climate Influence in Energy Consumption Analysis
2.2. Building Simulation
- Each dwelling was considered as a unique space, although partitions were introduced between its rooms.
- The operational conditions, further described, were uniformly applied to the dwellings.
- The adjacent dwellings were considered as a unique space and without partitions between rooms and equipped and with the same operational conditions as the modeled house, which is why the transfer through the surfaces in contact with them was considered adiabatic.
- Only the kitchen and living room were considered as conditioned spaces, which is why it was assumed that there was thermal transfer through the surface in contact with the modeled dwelling.
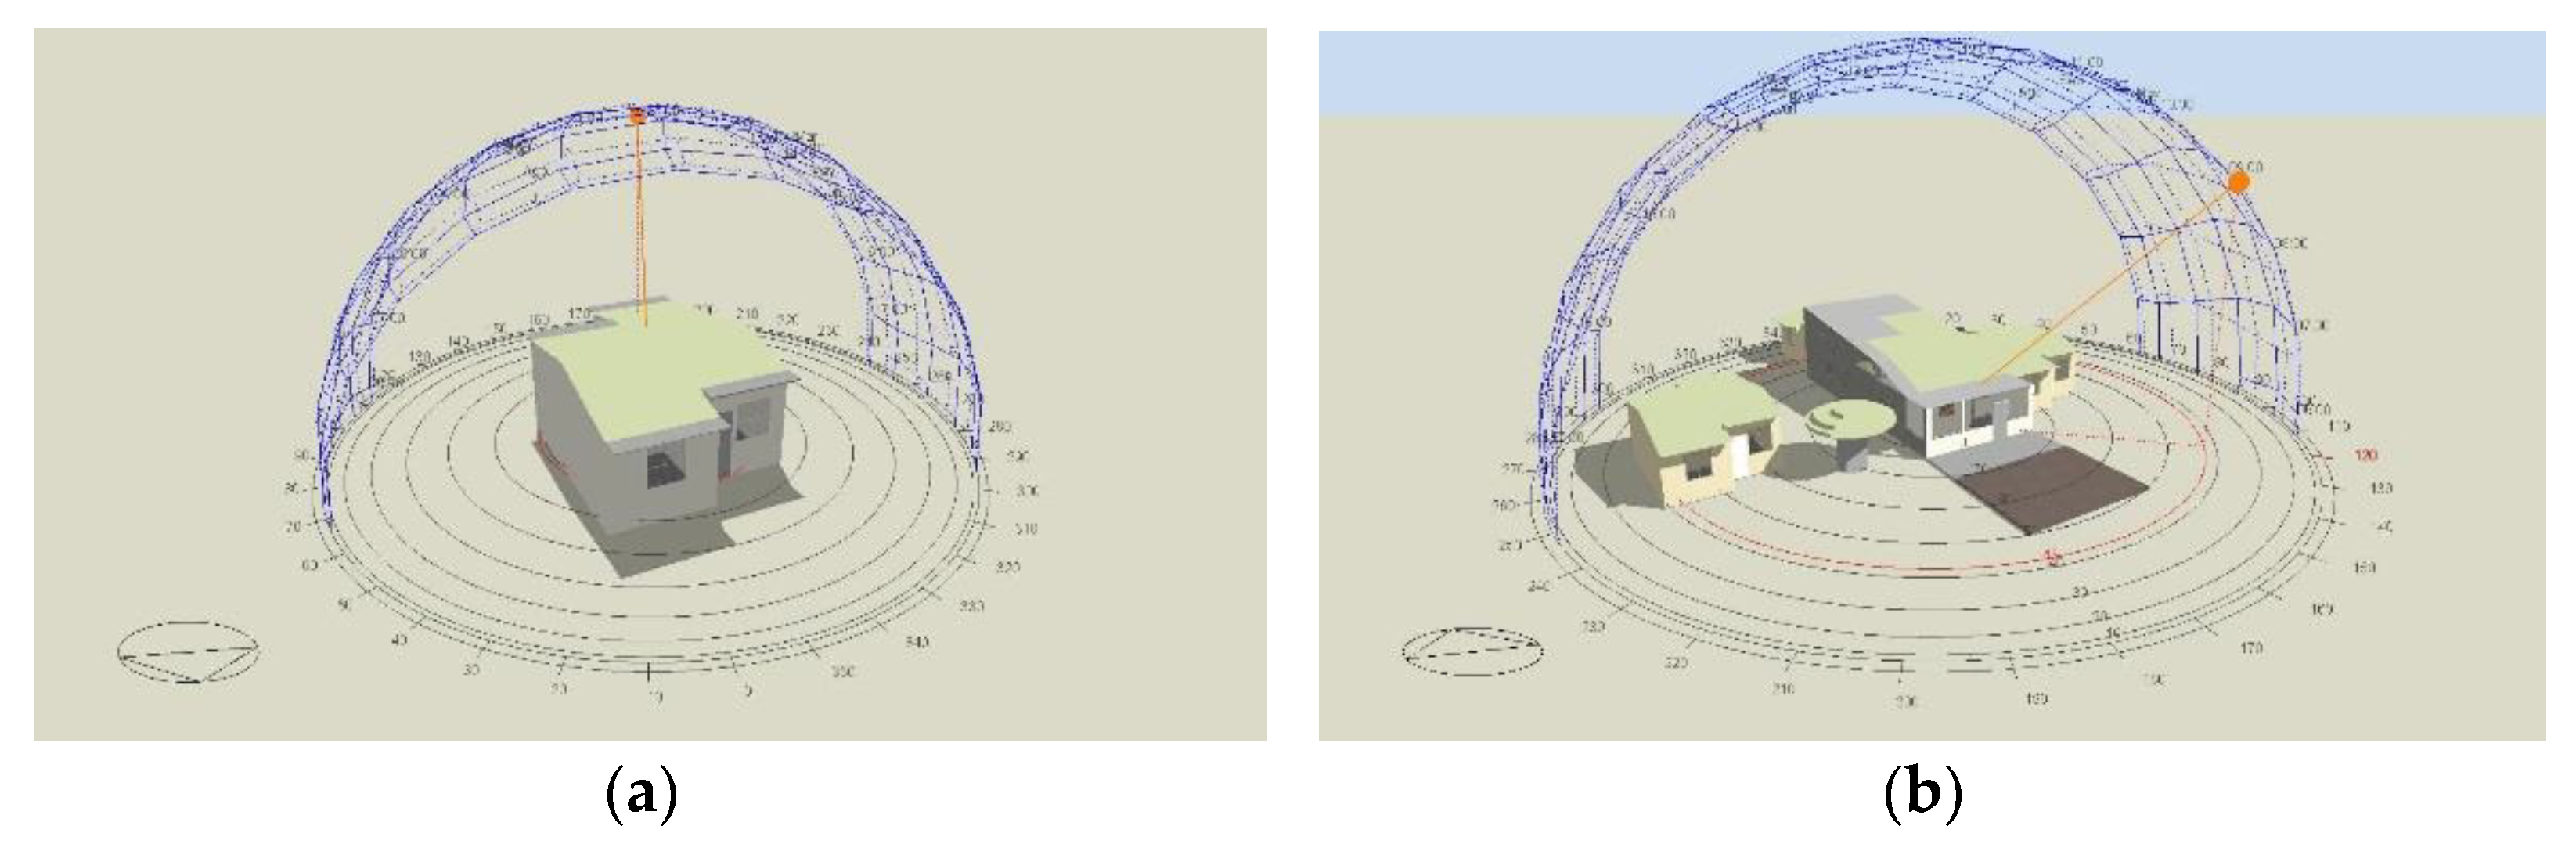
- Shade from the building itself and that thrown by surrounding buildings and trees was considered.
2.2.1. Input Data
- Location: Guayaquil (Ecuador) (S 2°7′) (W 79°57′) (GMT-5.0 Hour)
- Elevation: 4 m.s. Standard atmospheric pressure: 101,277 Pa
2.2.2. Calibration
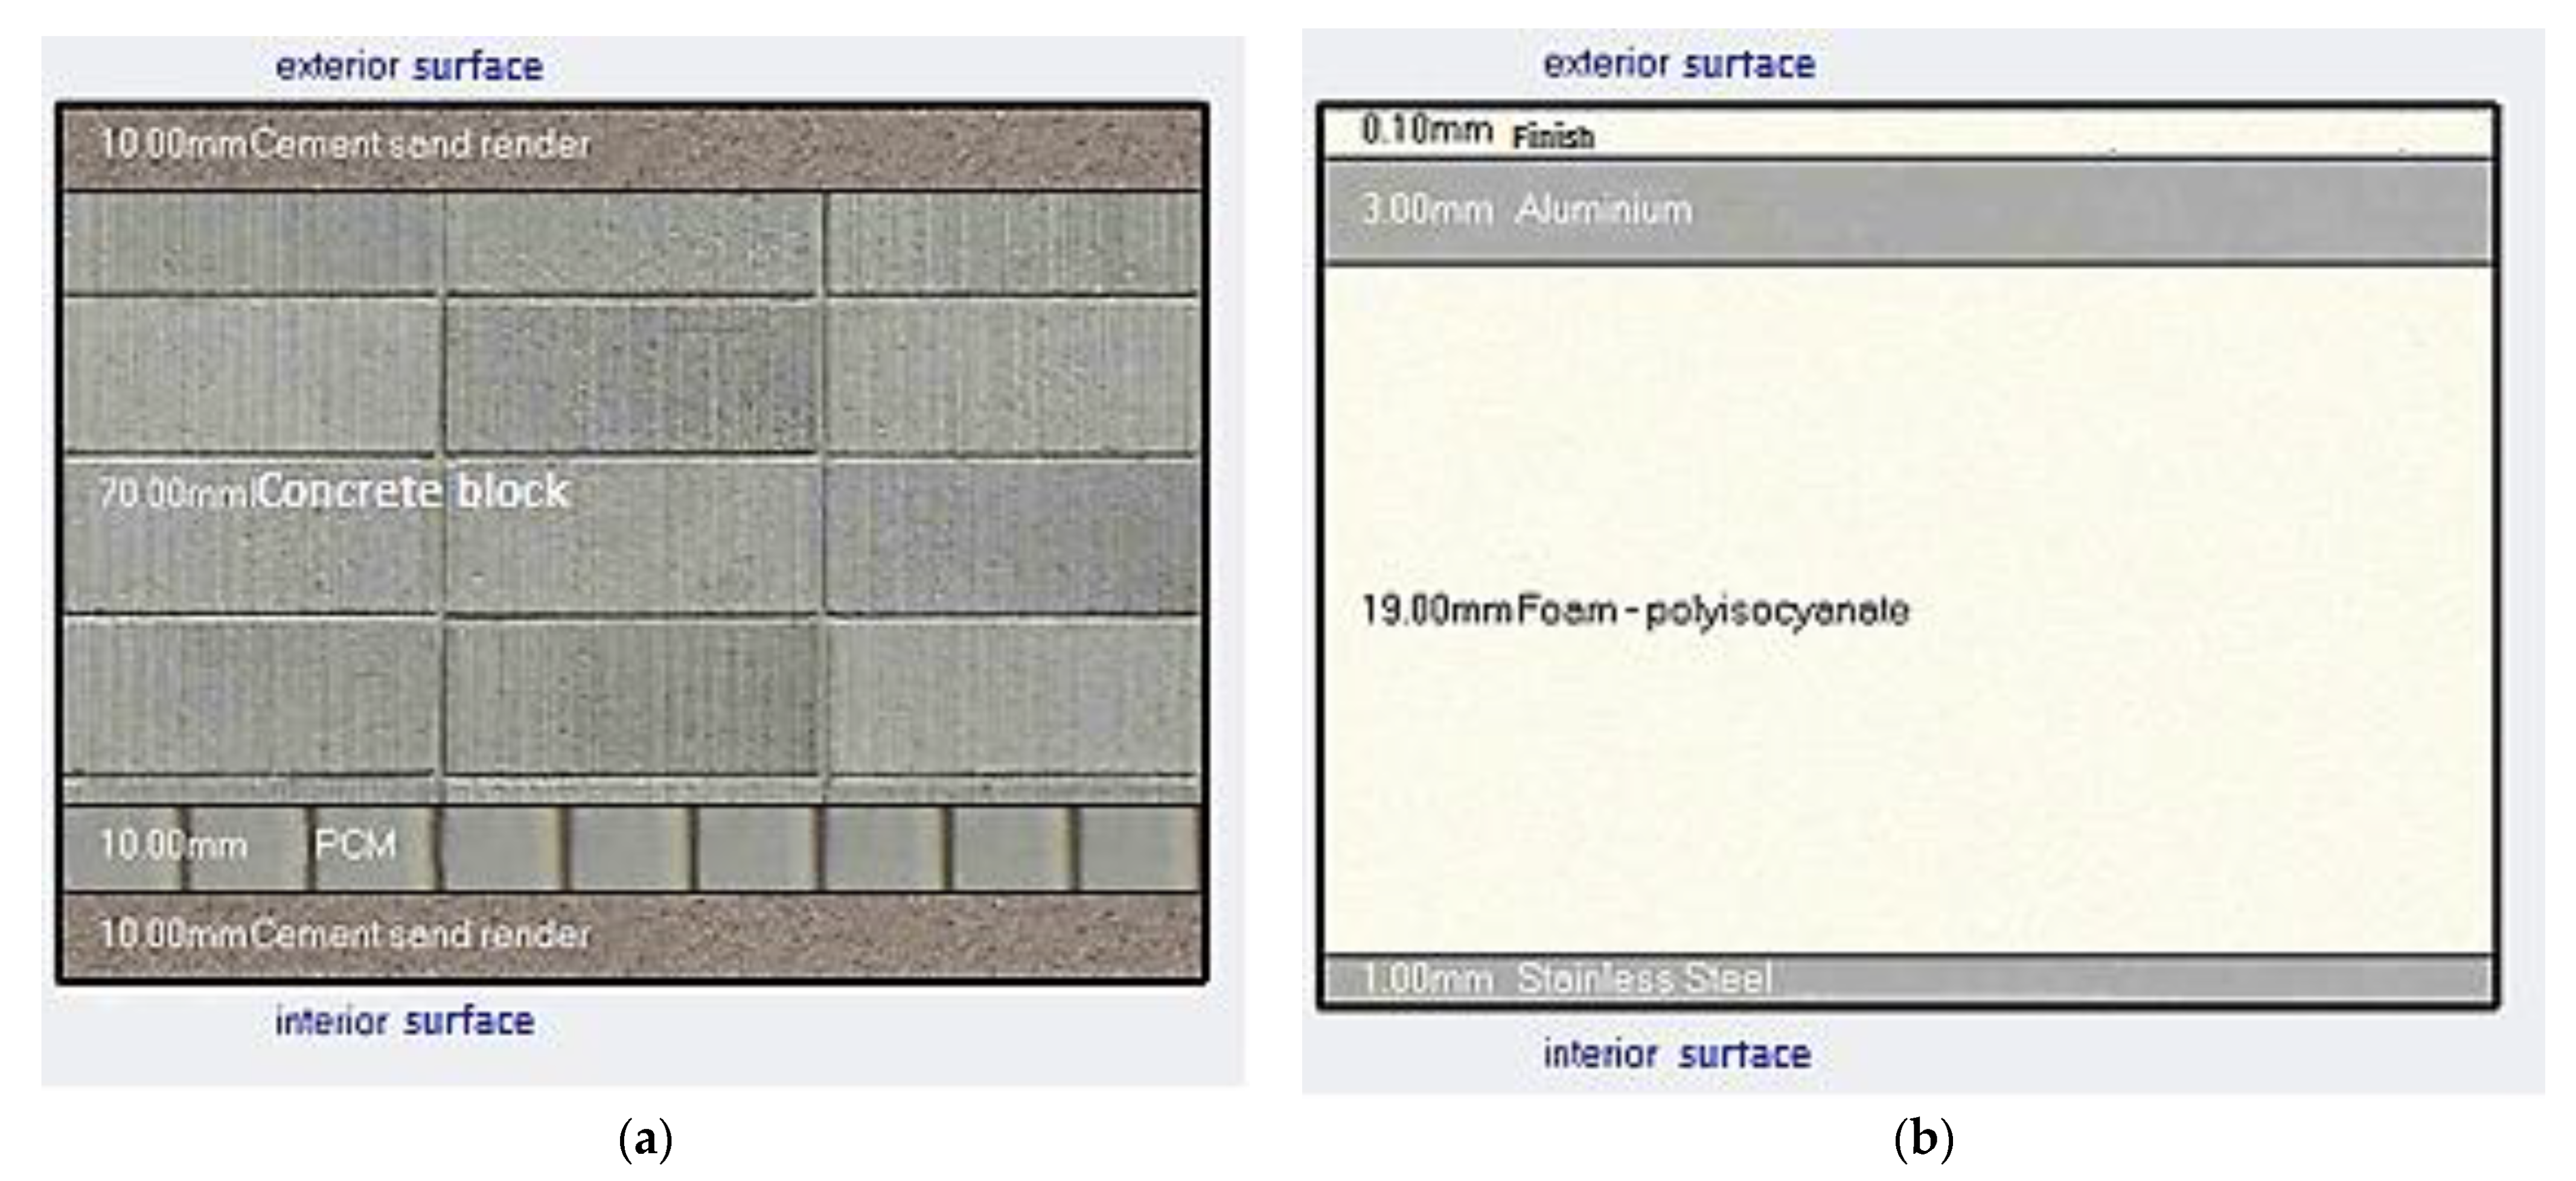
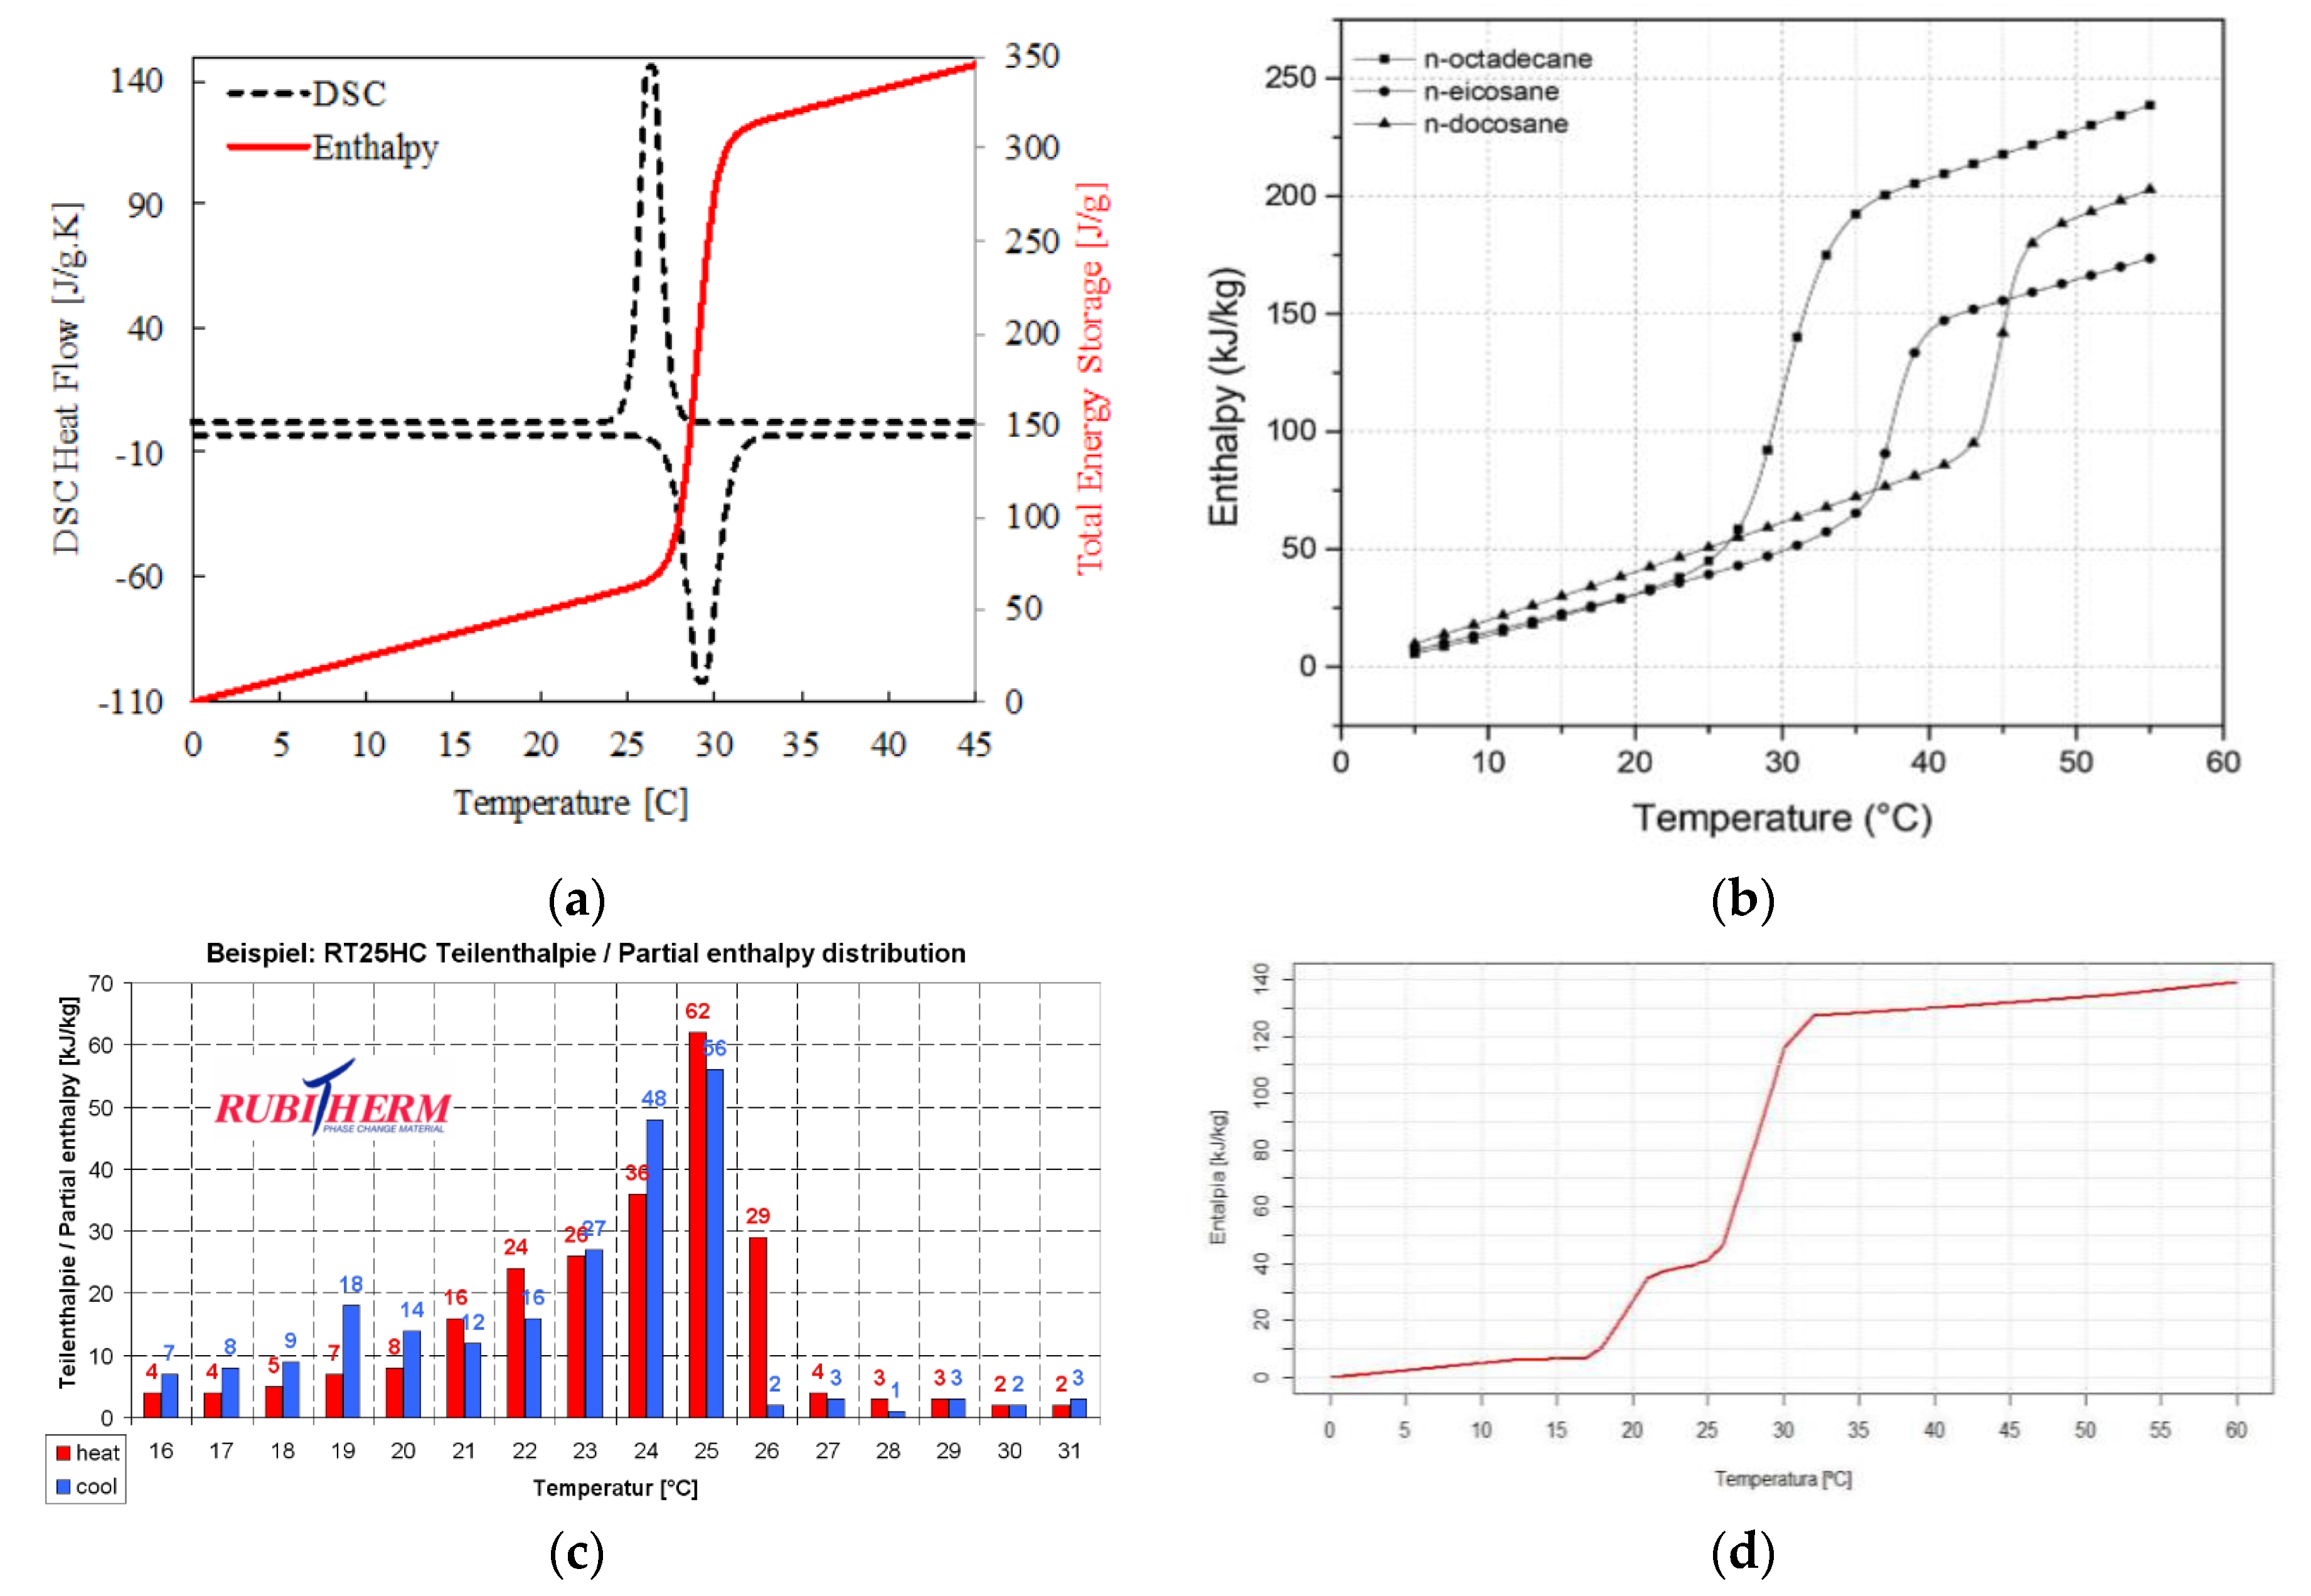
2.2.3. Phase Change Materials (PCM) as Alternative to Improve Thermal Comfort
2.3. Comfort Evaluation
3. Results and Discussion
3.1. Selection of Reference Dwellings
3.1.1. Description of the Area under Study and Electricity Billing Fees
3.1.2. Spatial Distribution Analysis
3.1.3. Climate Influence in Energy Consumption Analysis
3.1.4. Selection of Study Dwellings
3.2. Building Simulation
3.2.1. Input Data
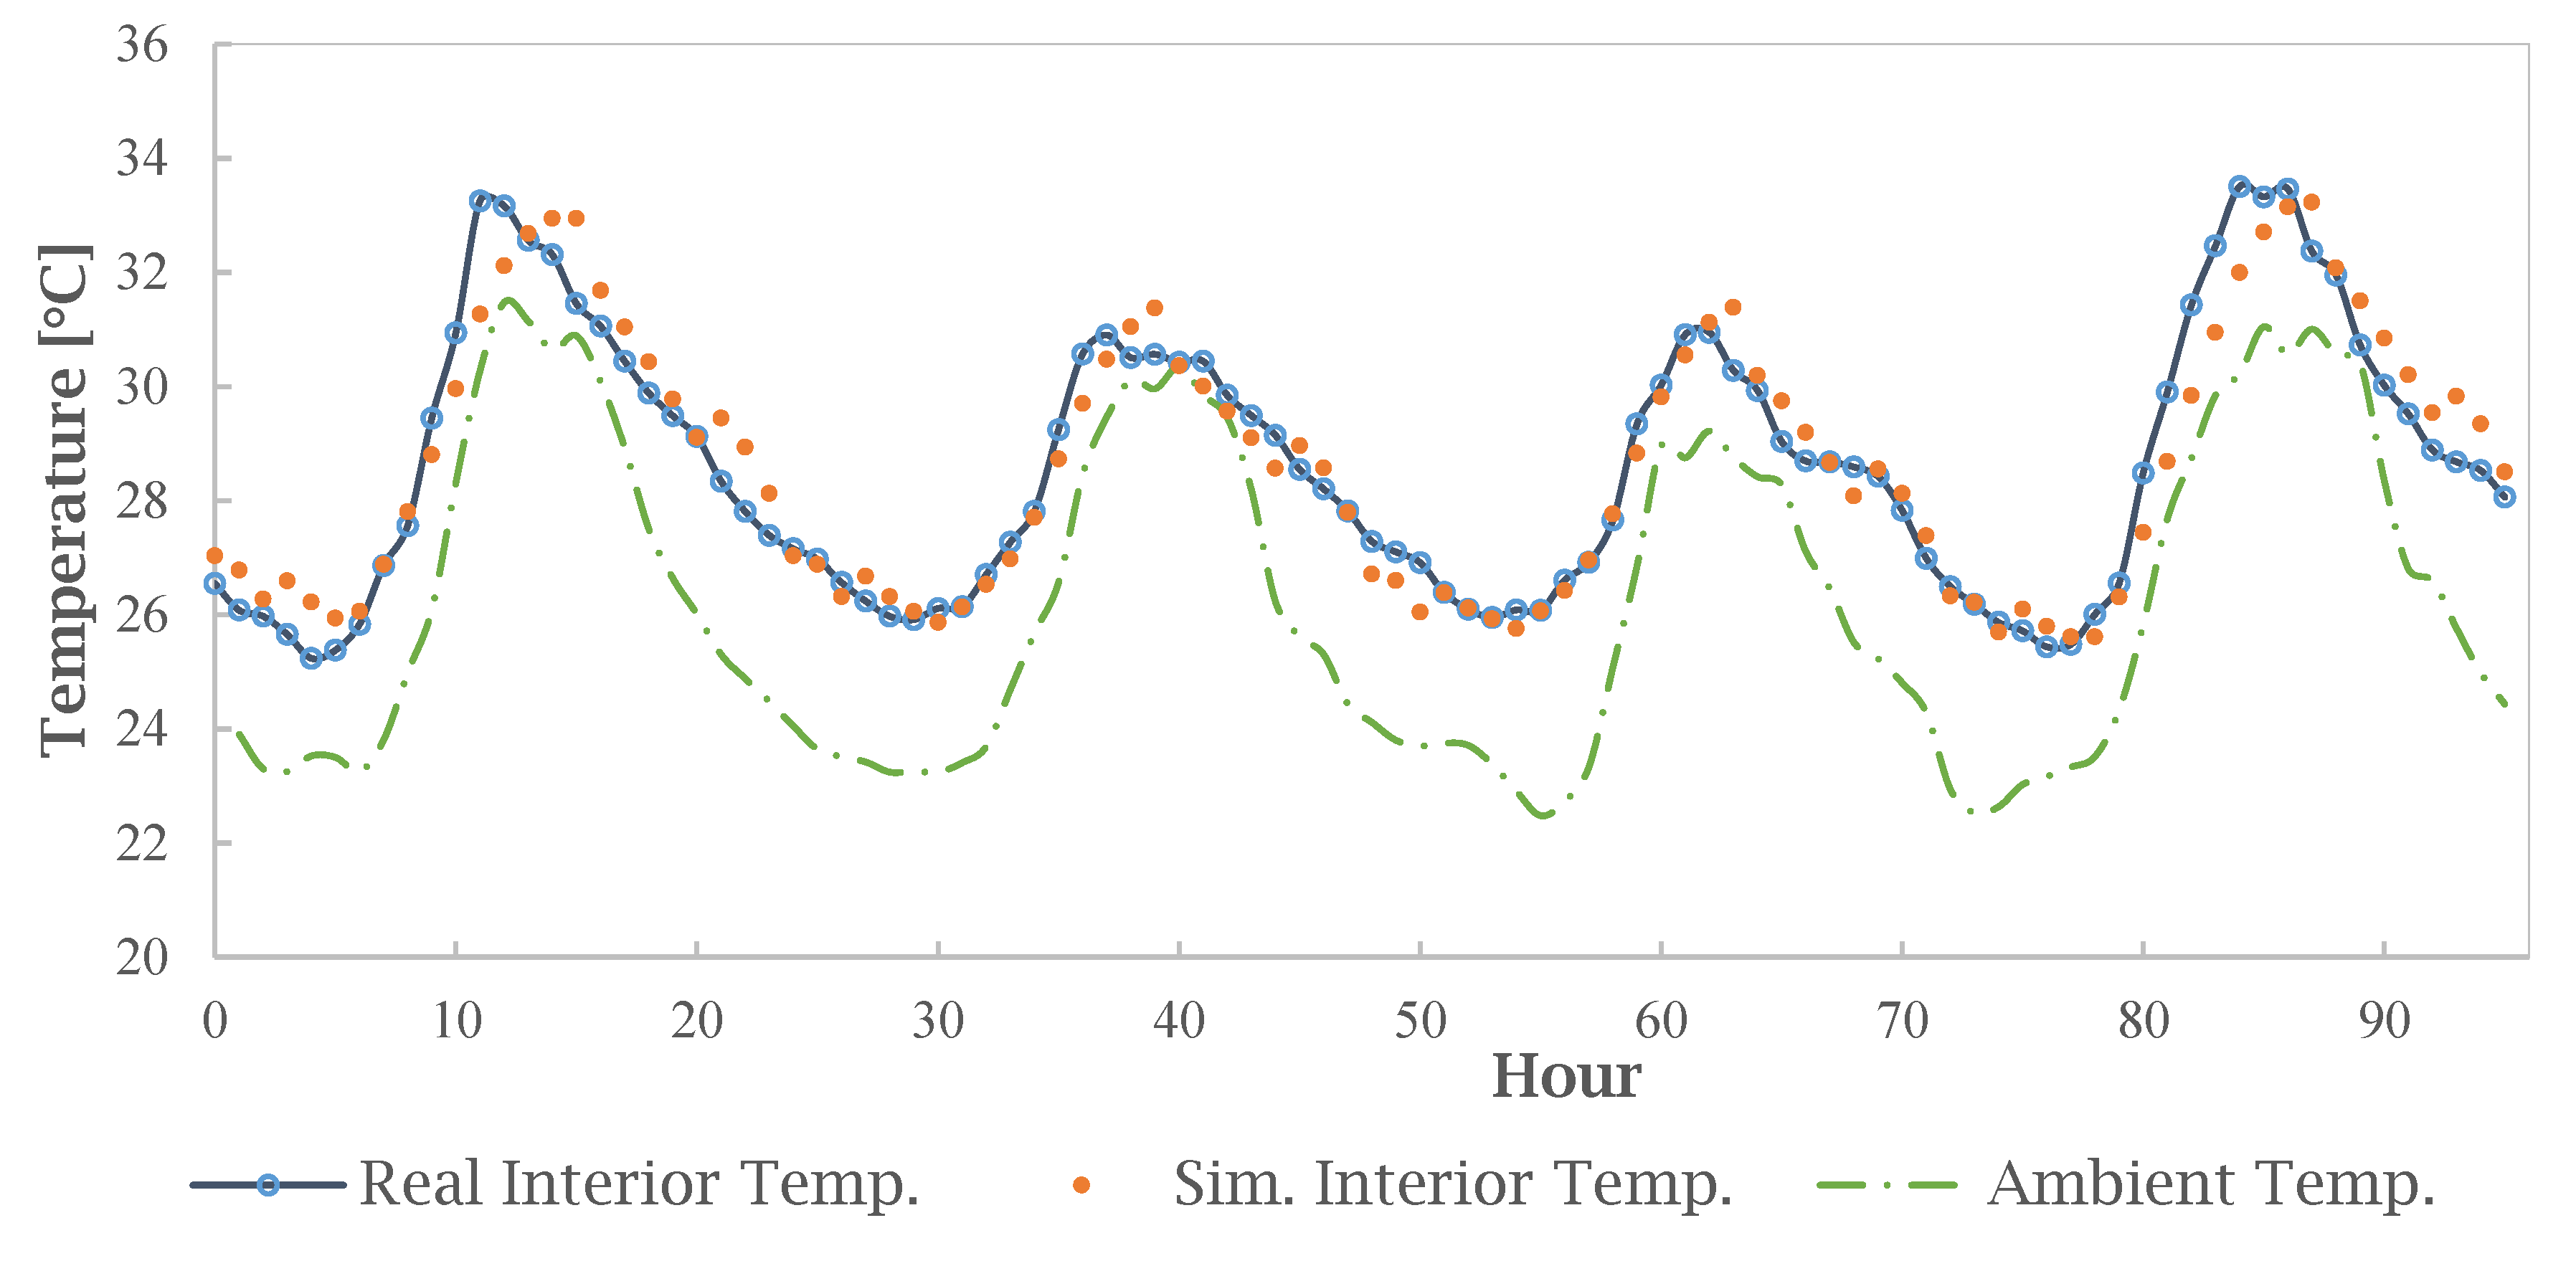
3.2.2. Calibration
3.2.3. Best Improves in the Study Cases
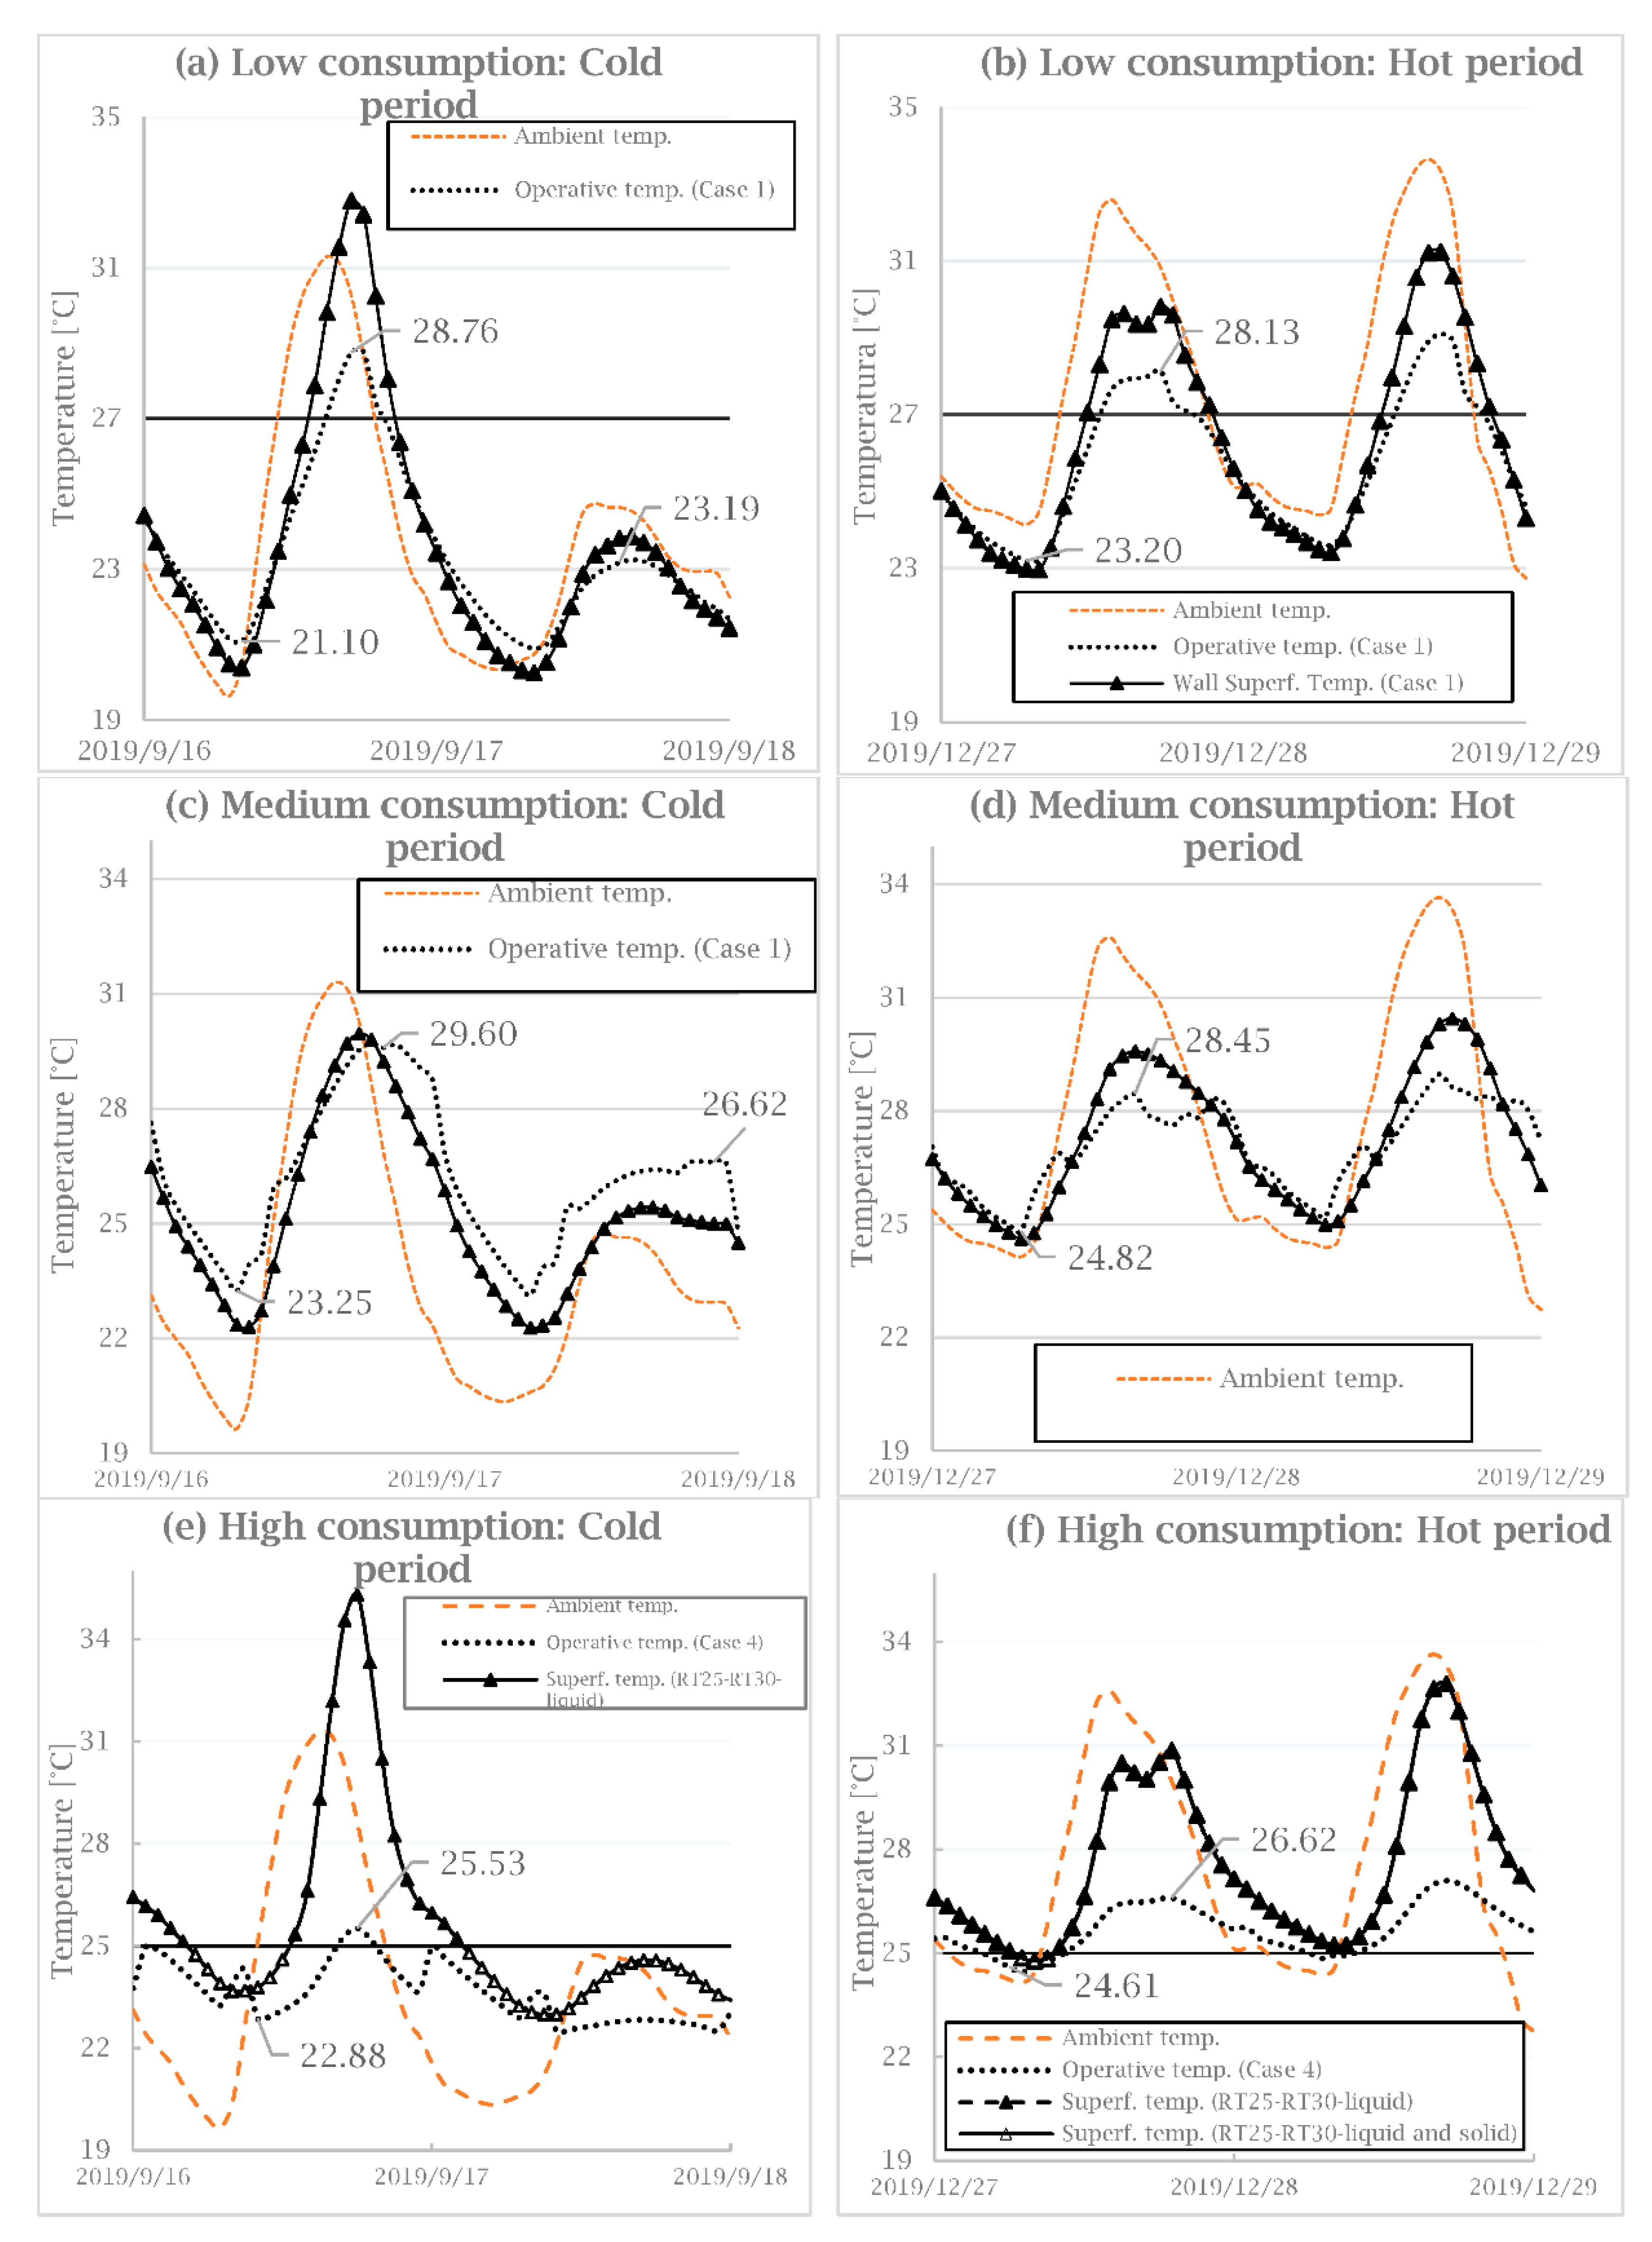
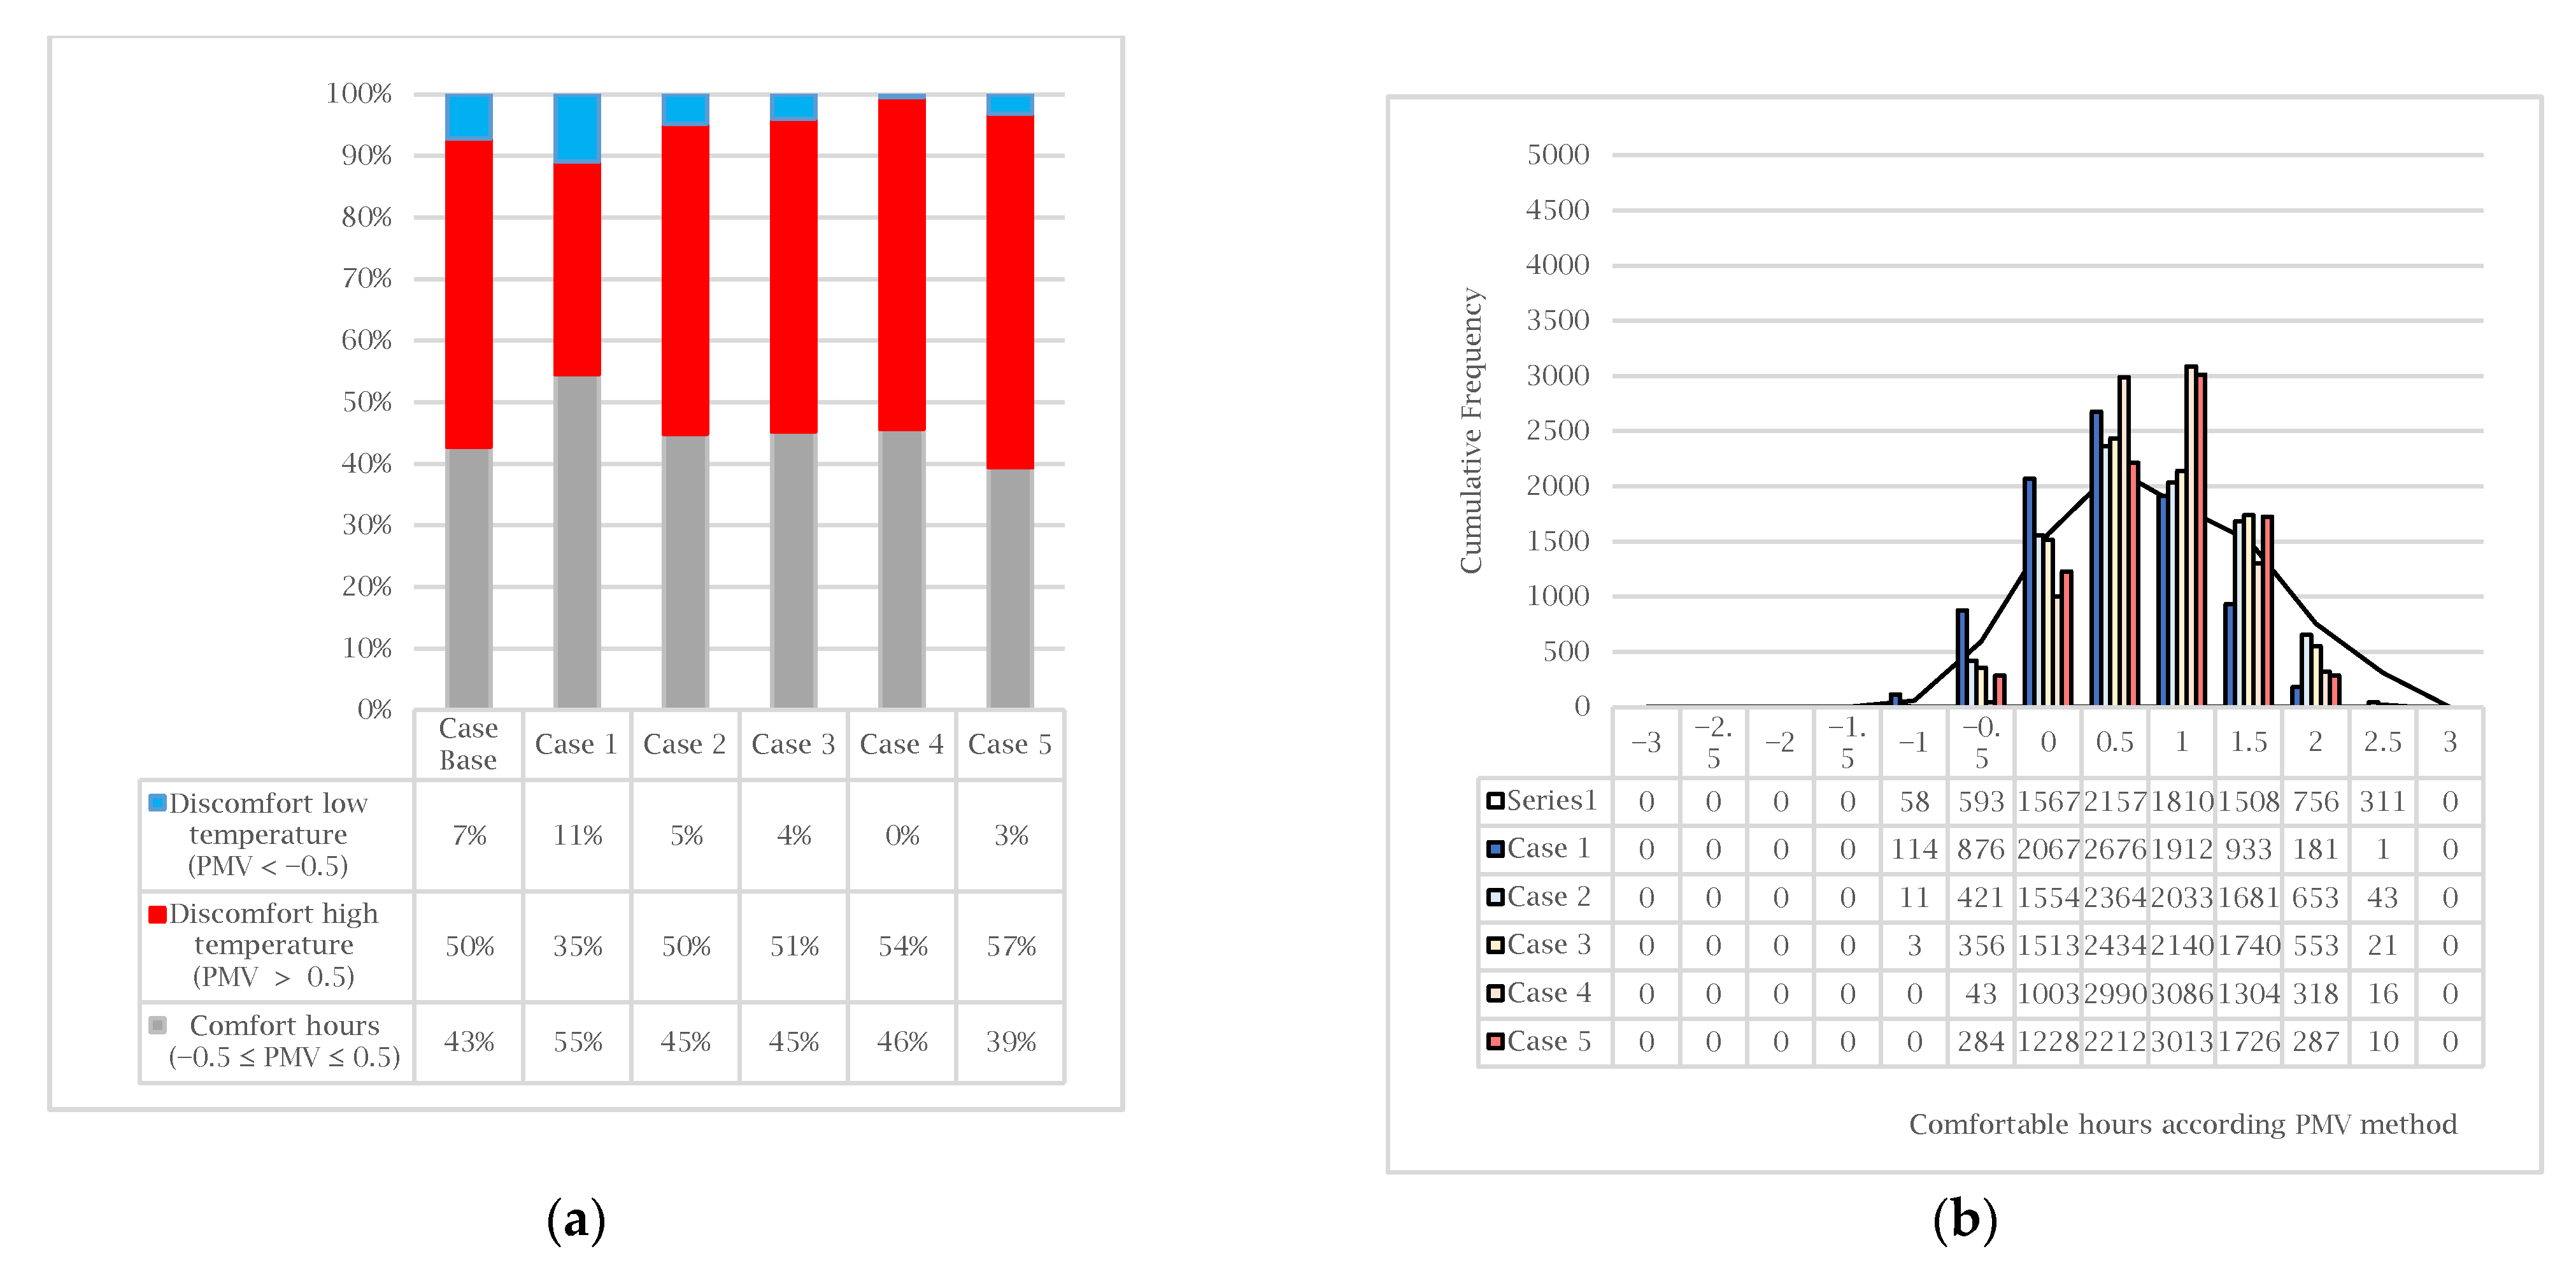
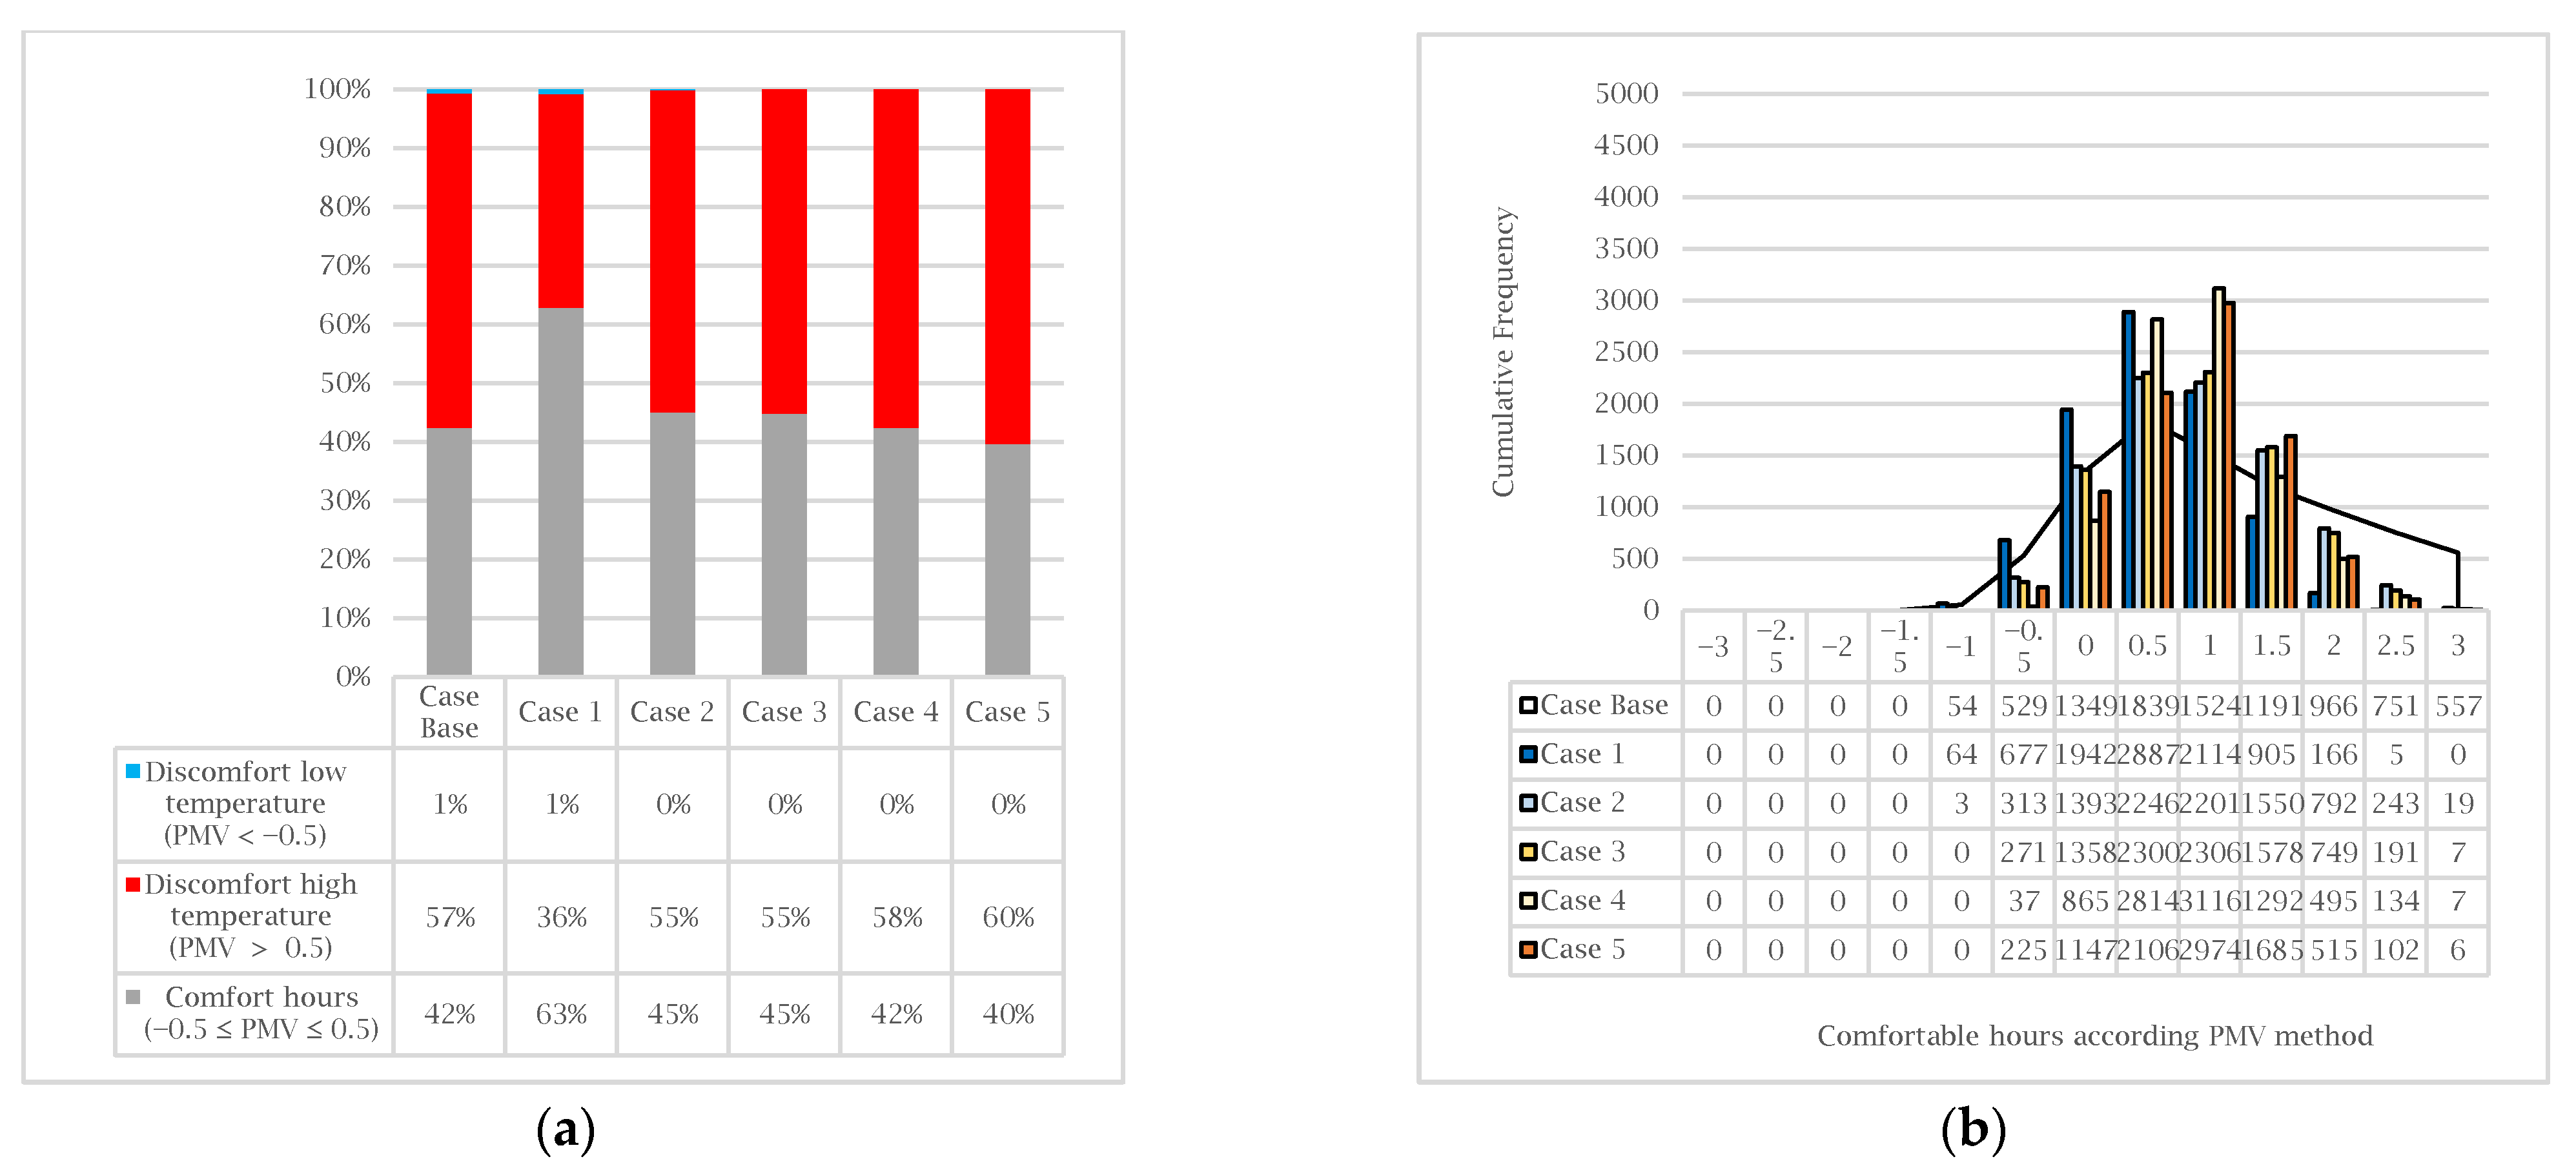
3.3. Comfort Analysis
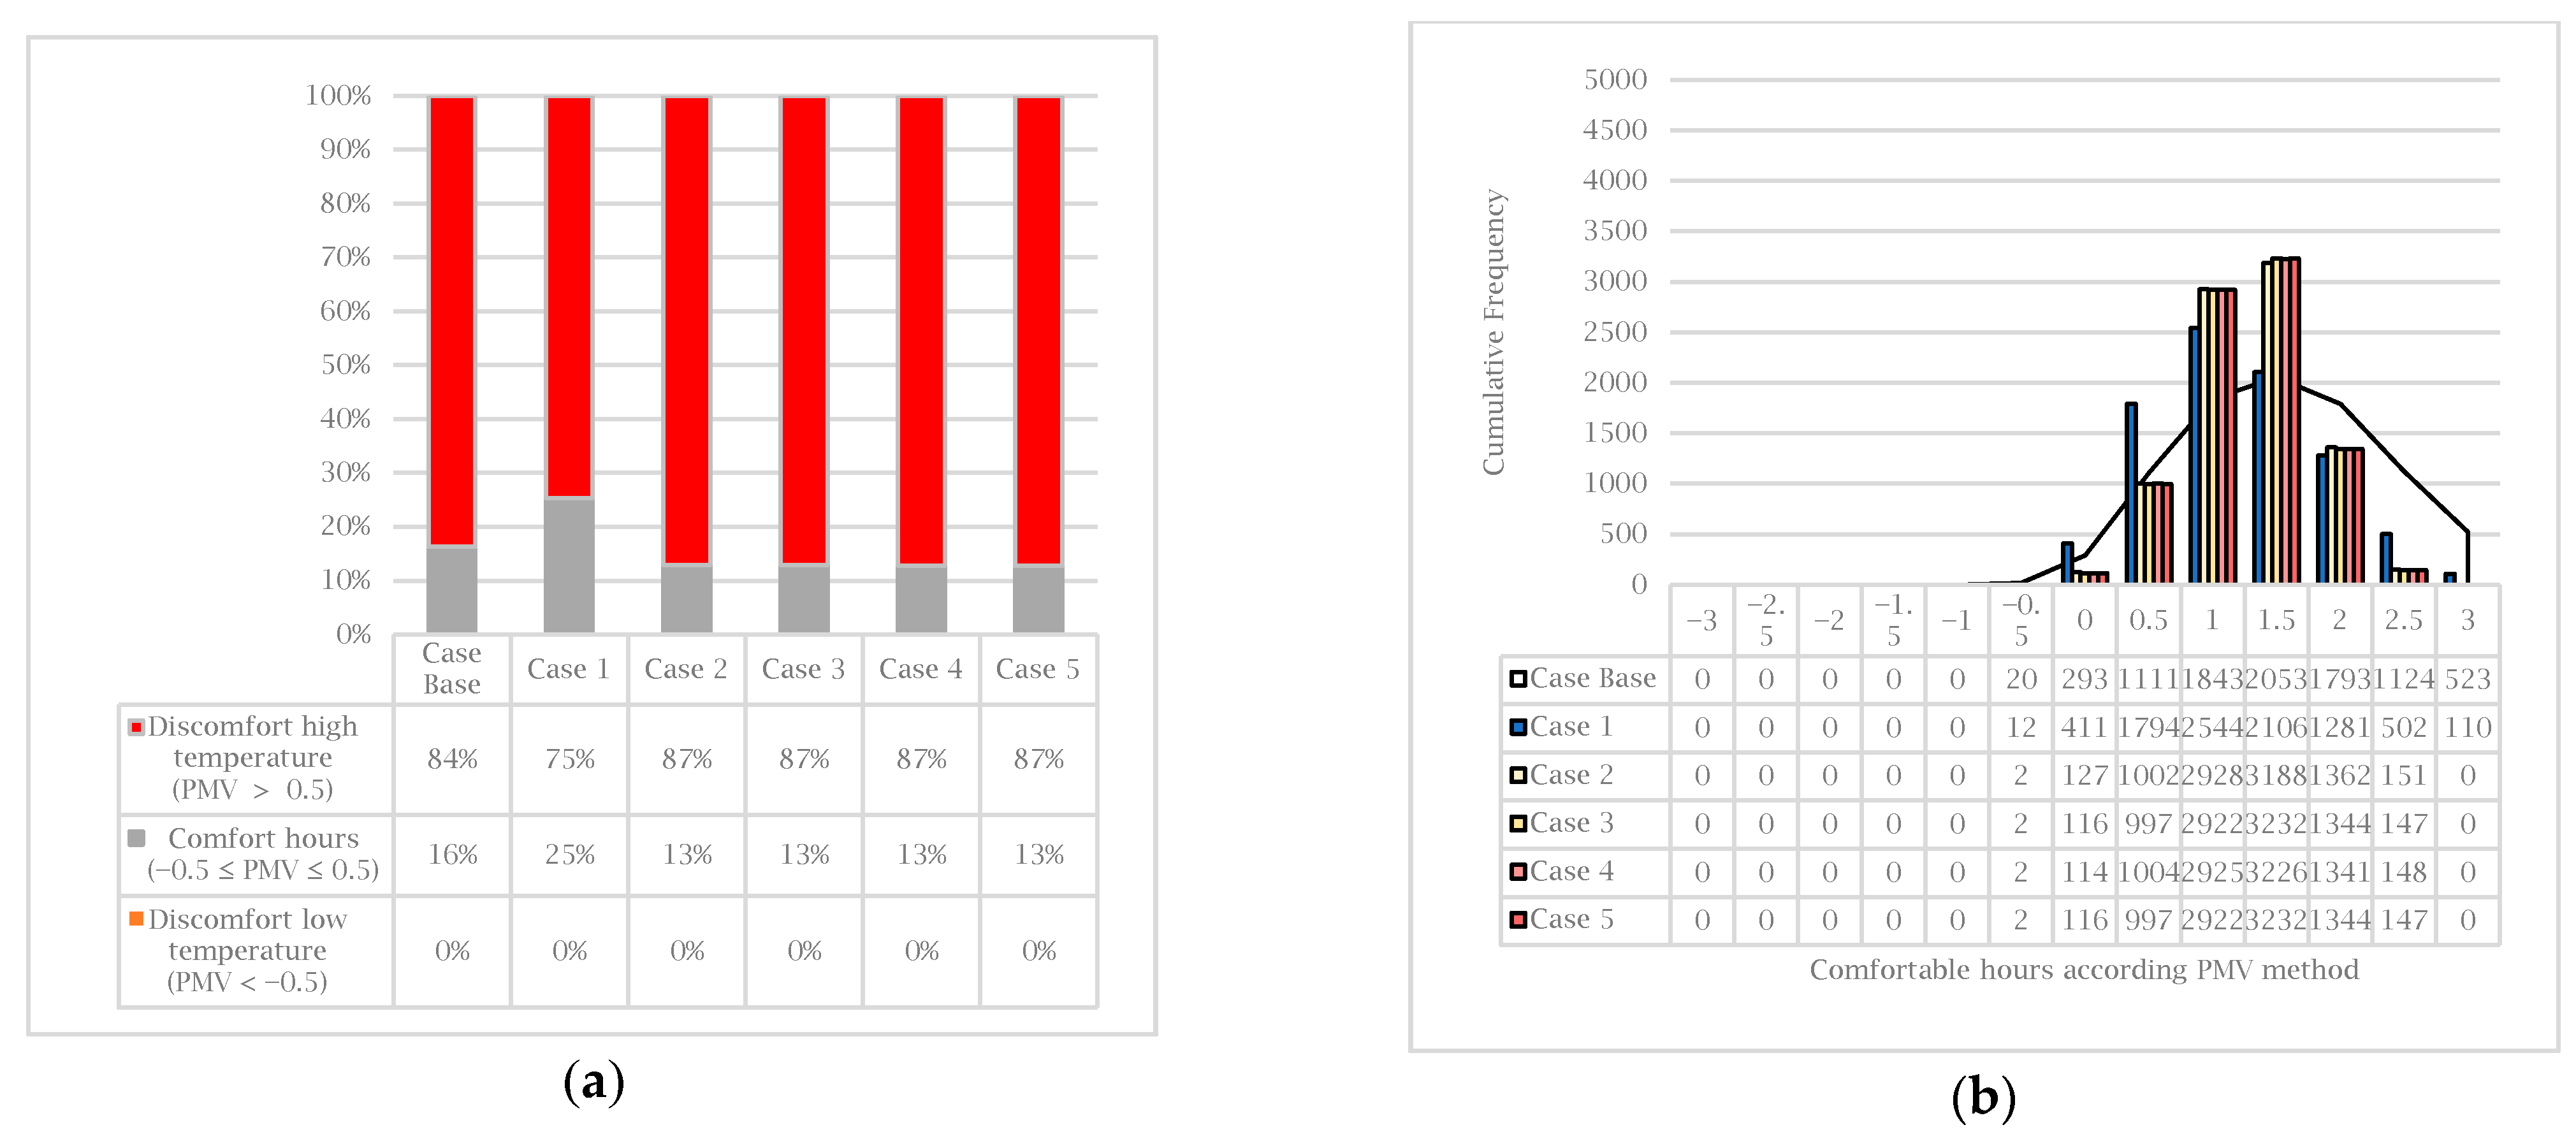
3.3.1. Low Consumption Dwelling with Air Conditioning System
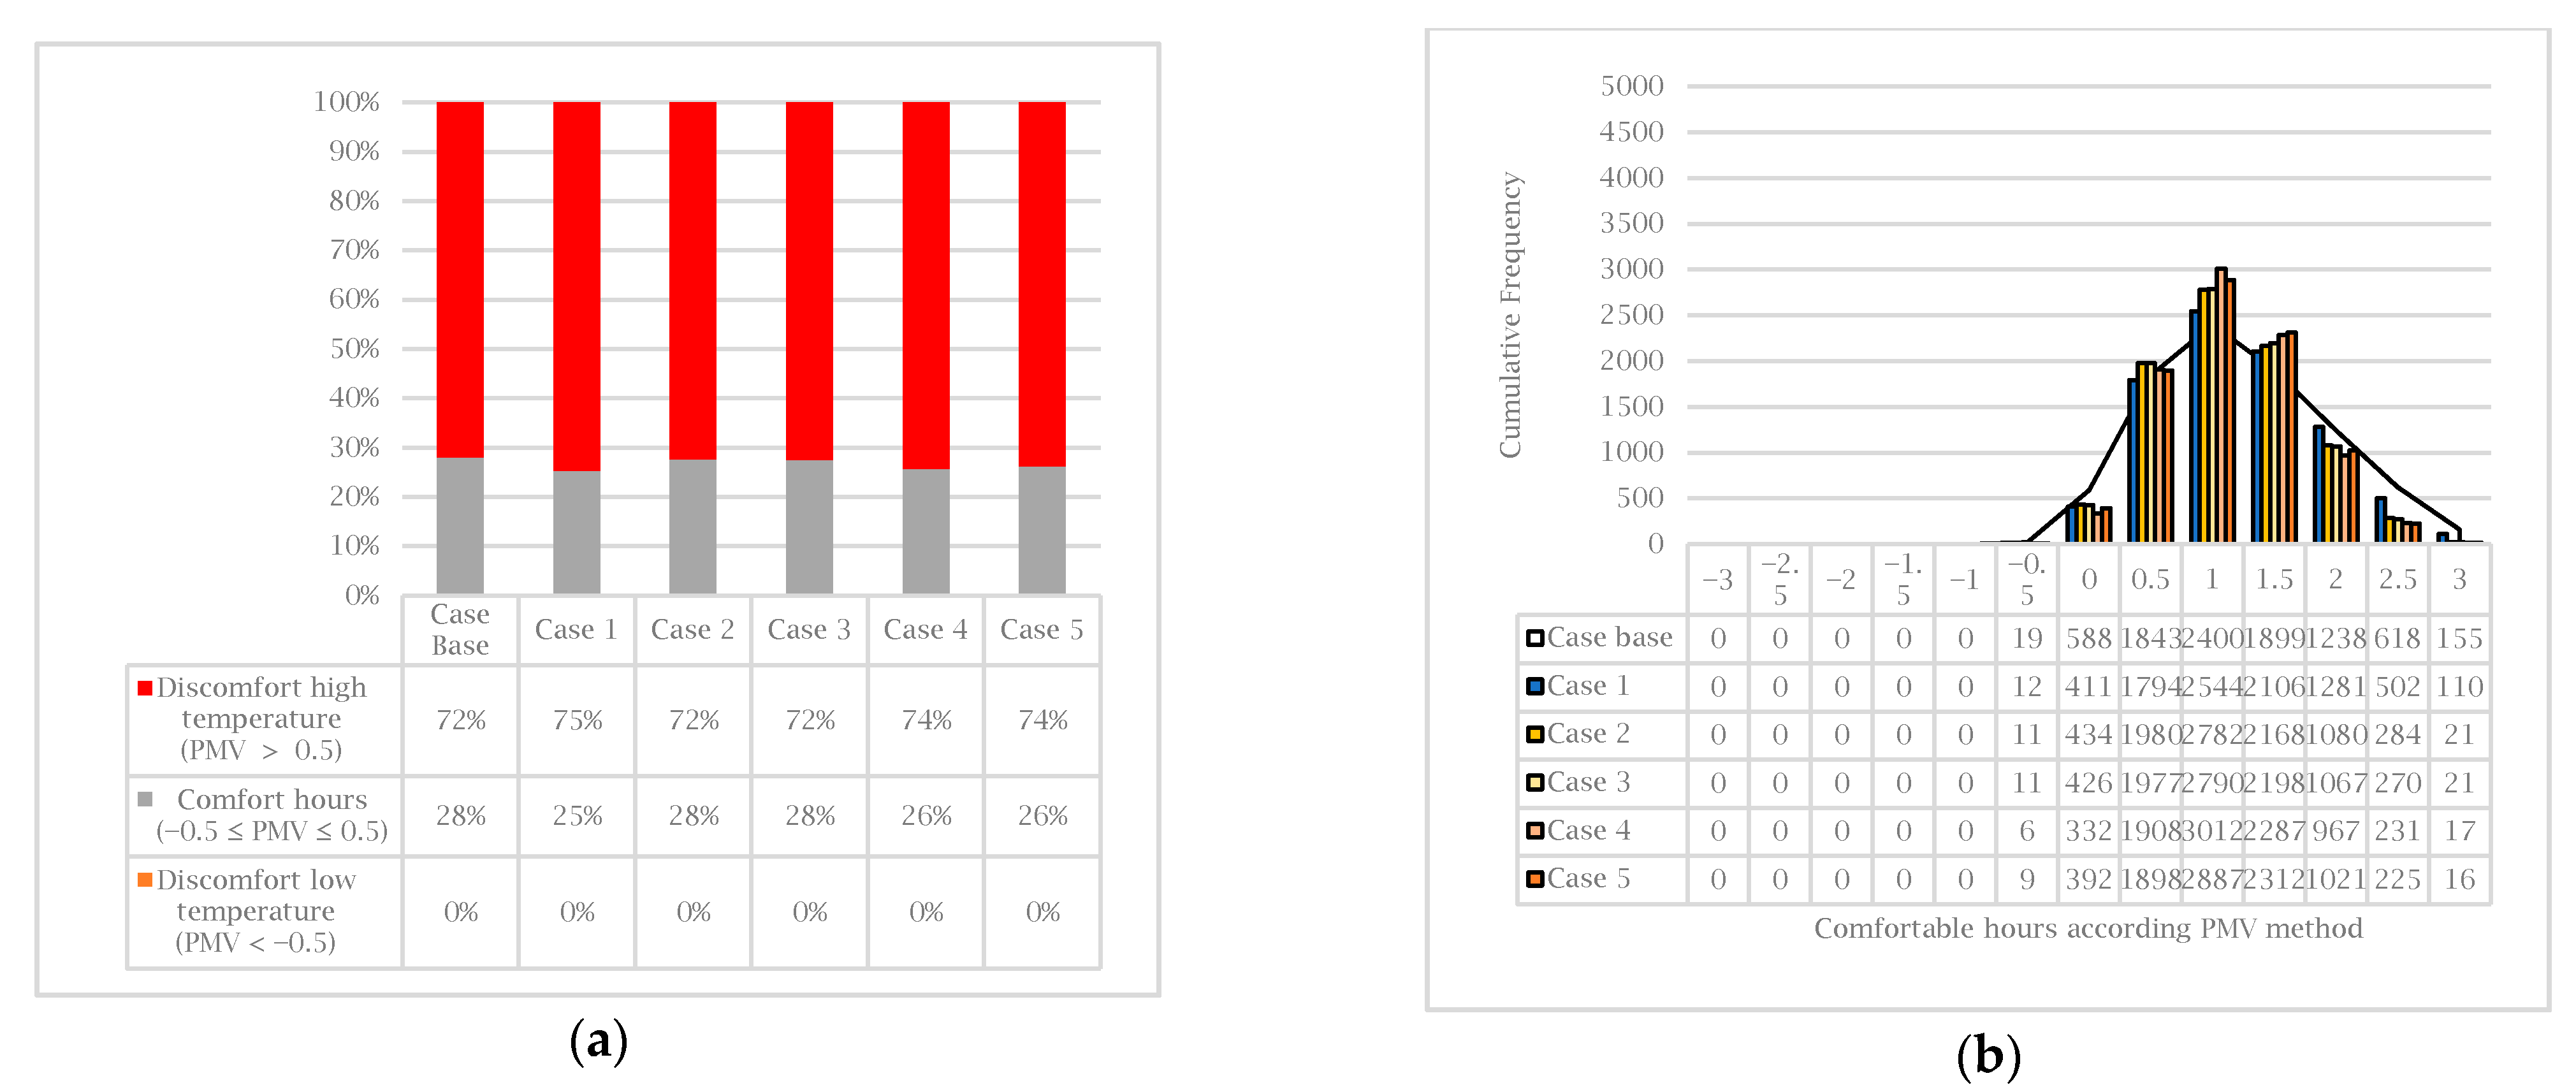
3.3.2. Medium Consumption Dwelling without Air Conditioning System
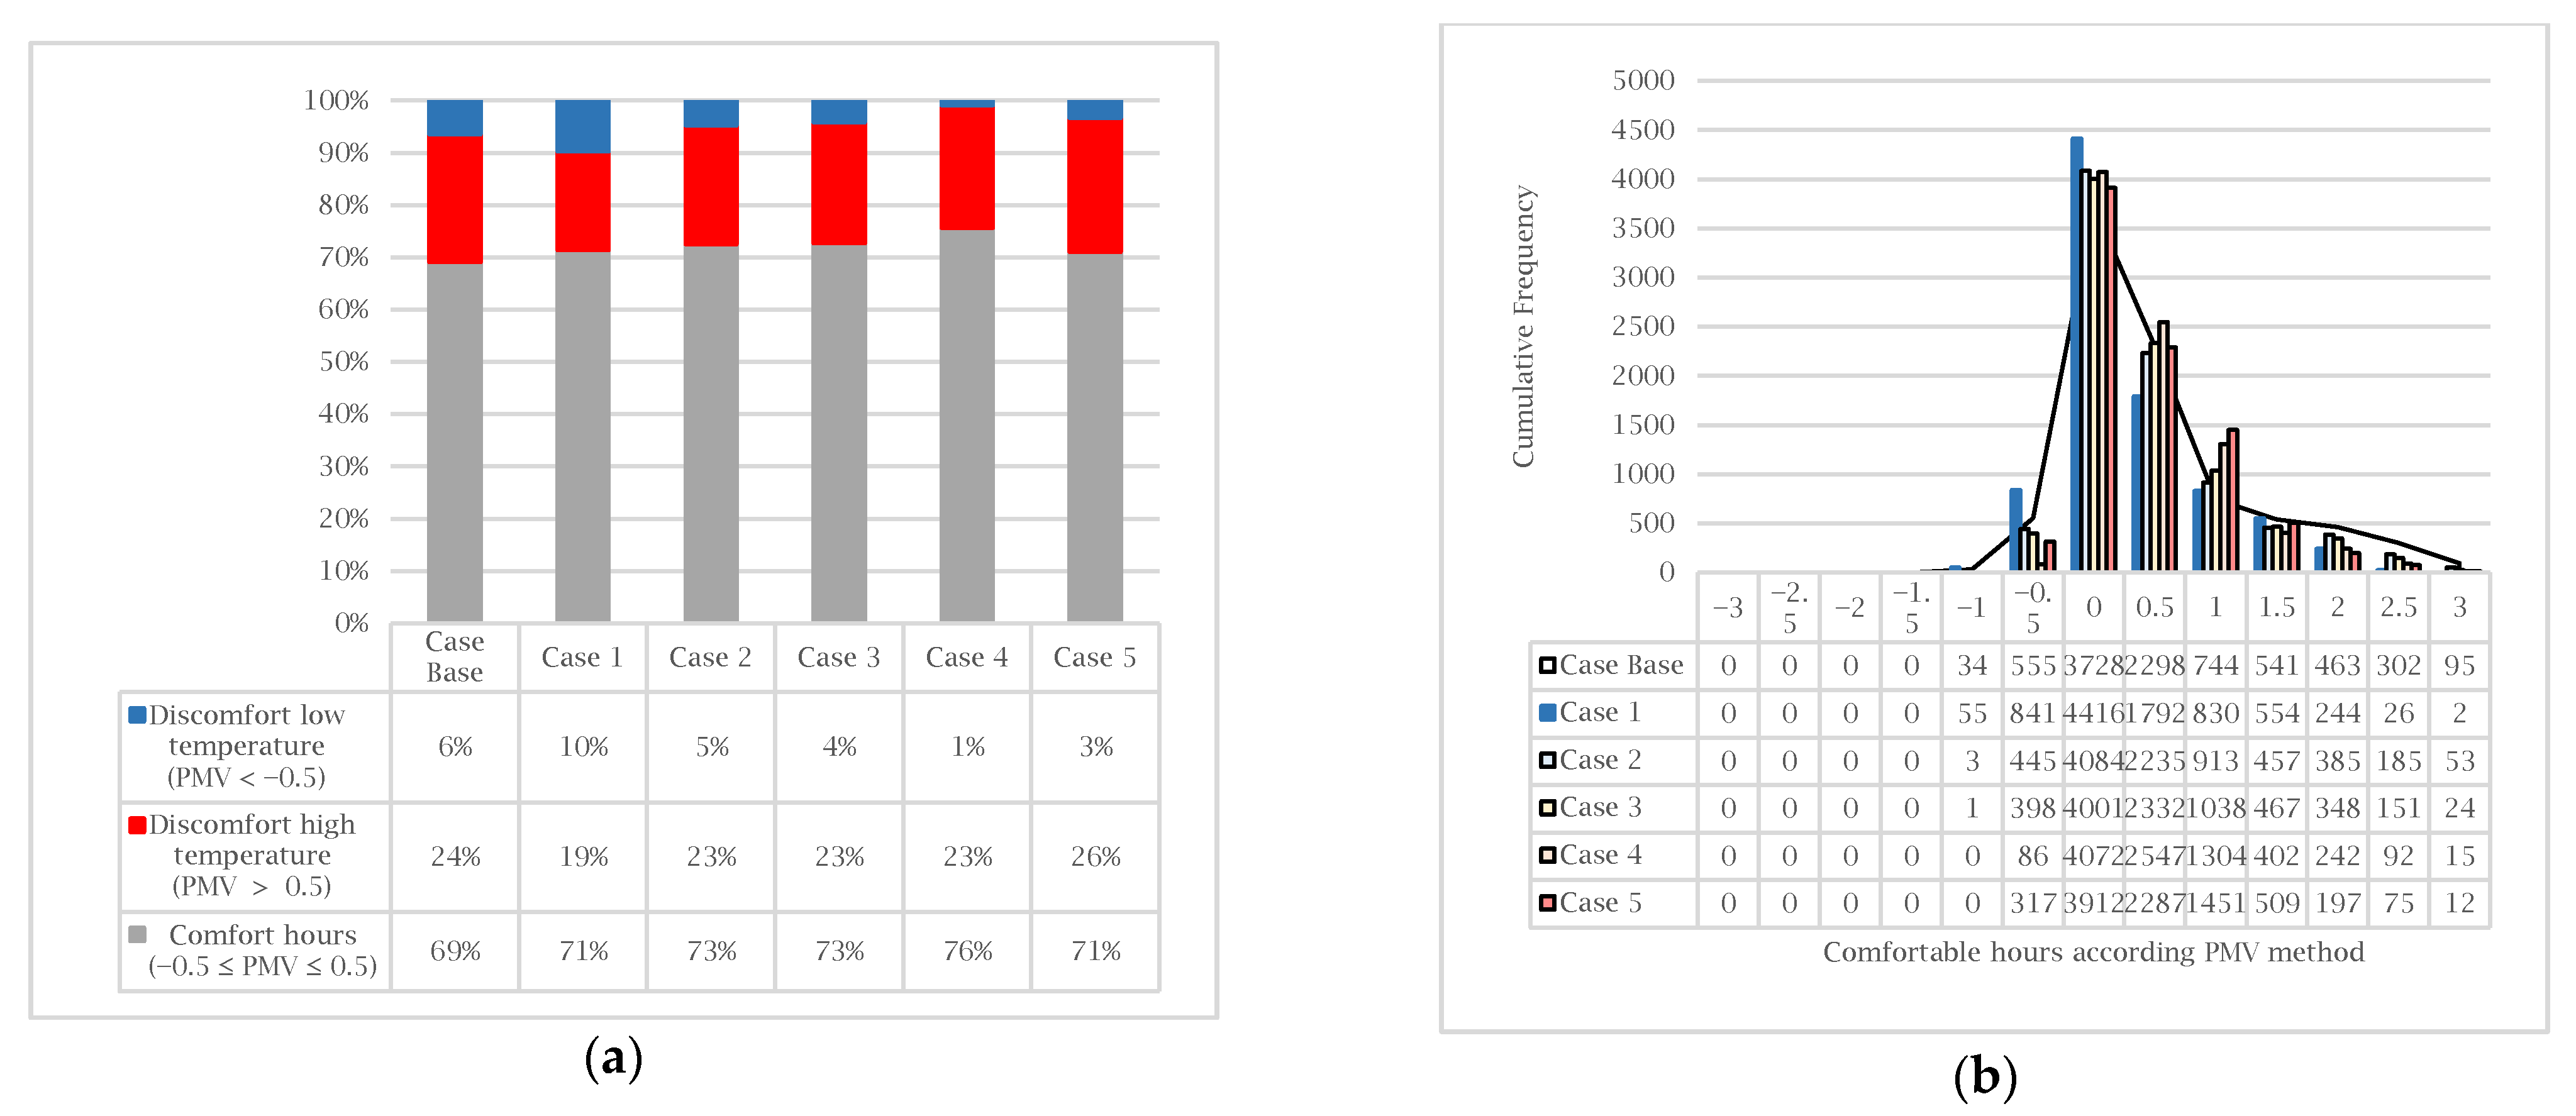
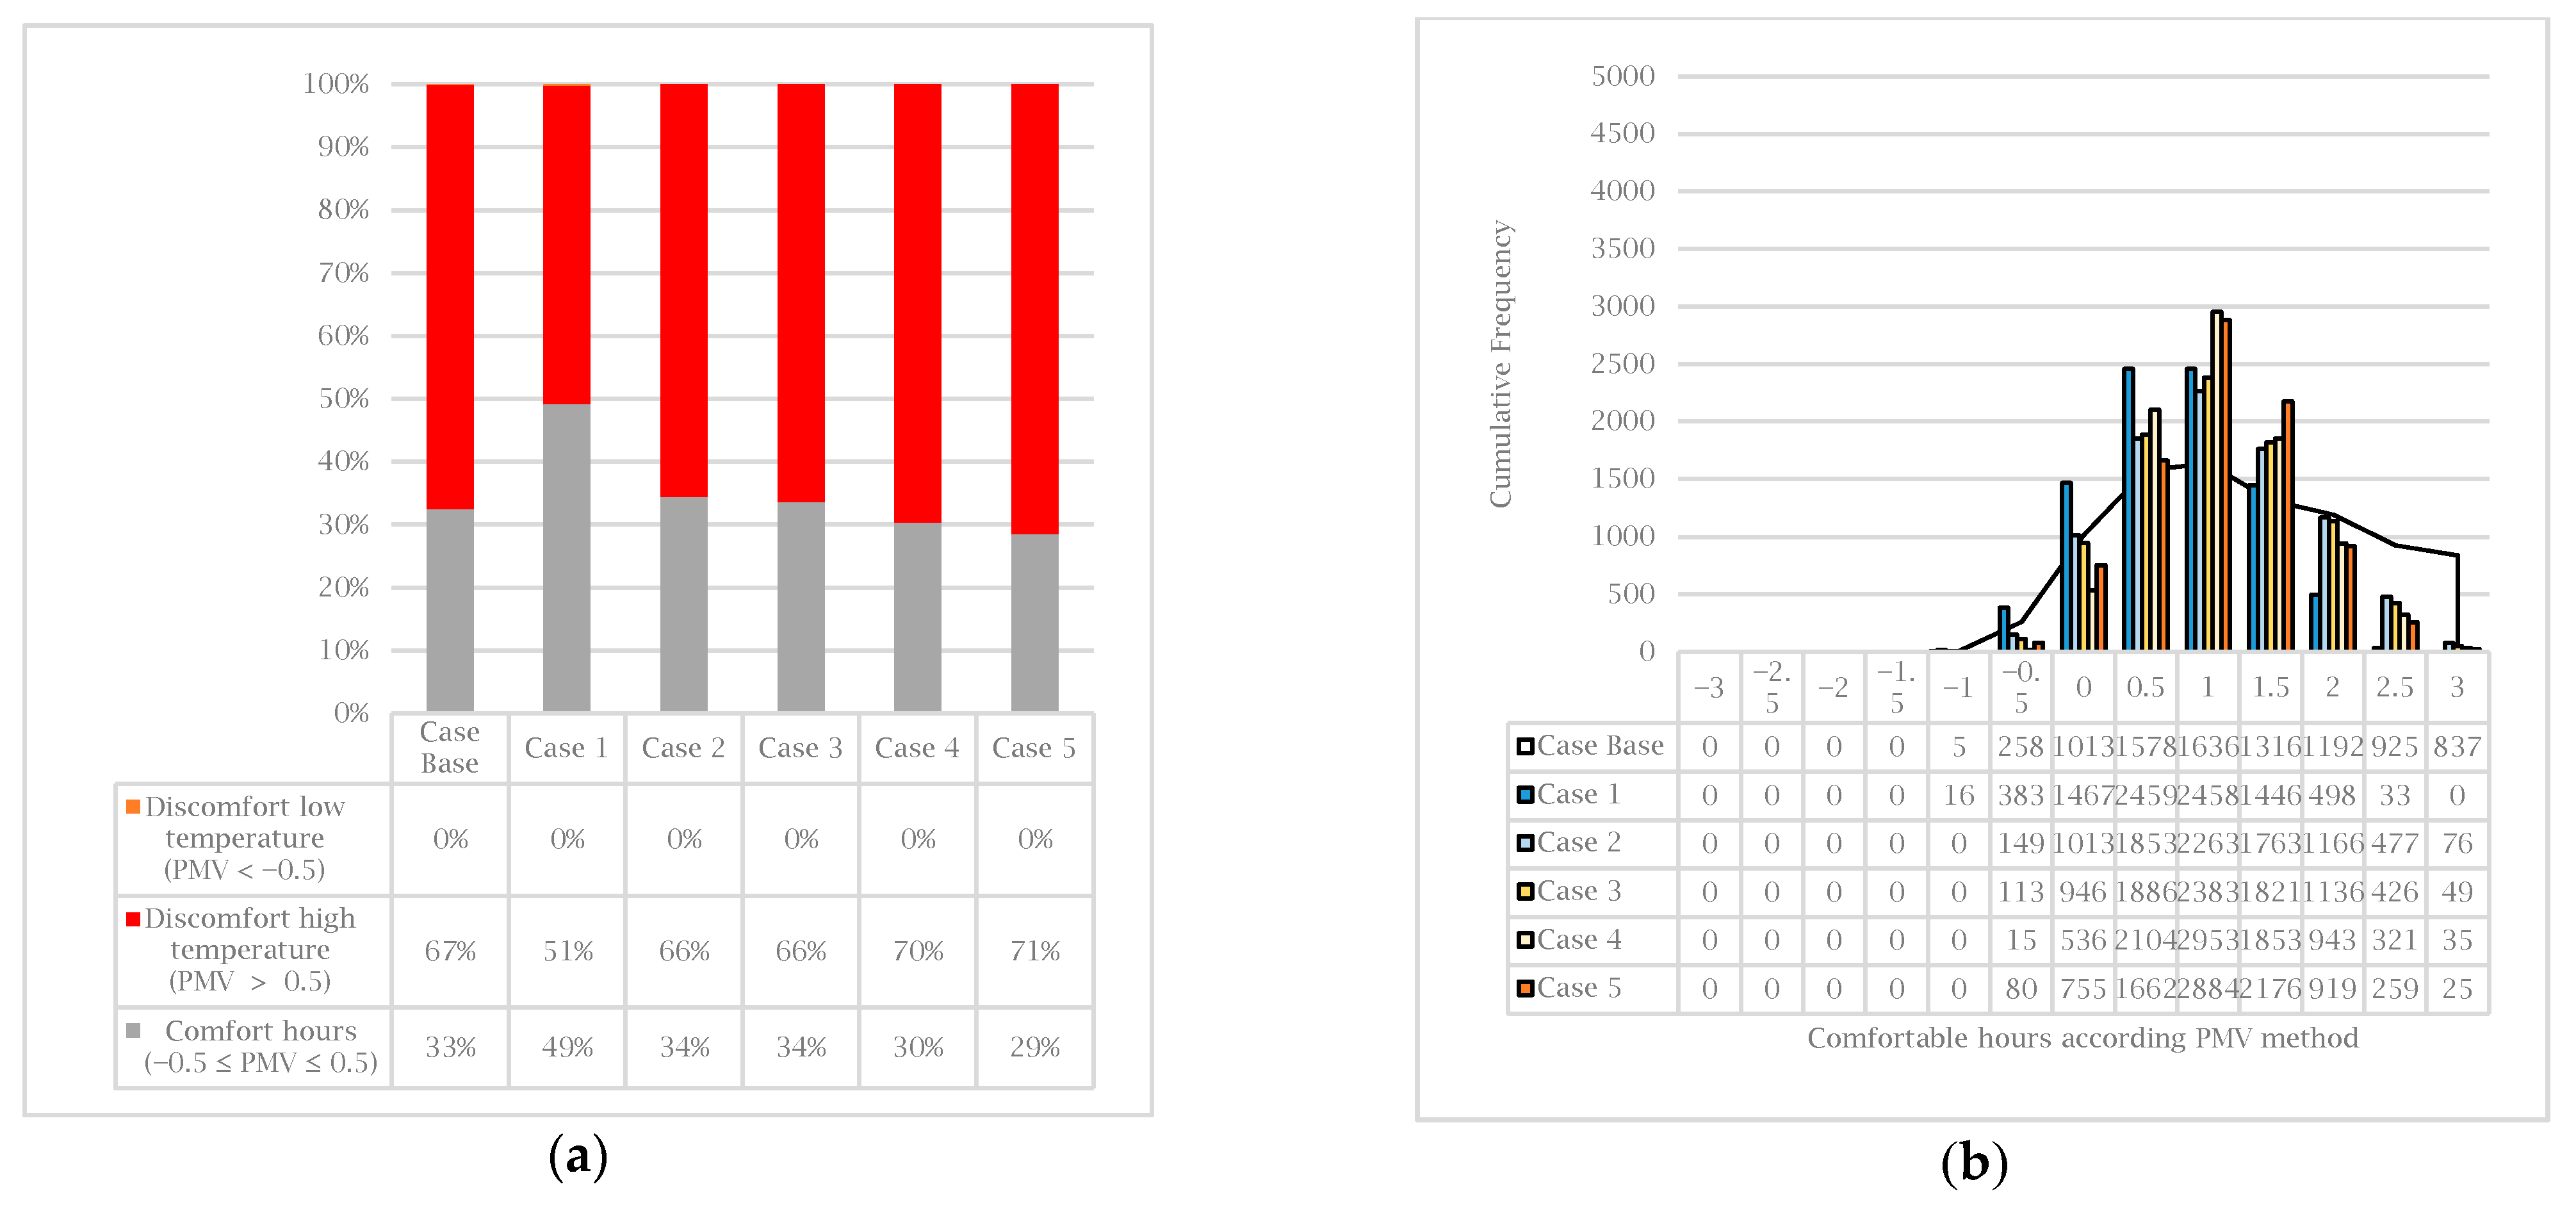
3.3.3. High Consumption Dwelling with an Air Conditioning System
4. Conclusions
Author Contributions
Funding
Institutional Review Board Statement
Informed Consent Statement
Data Availability Statement
Acknowledgments
Conflicts of Interest
References
- Buildings: A Source of Enormous Untapped Efficiency Potential. Available online: https://www.iea.org/topics/buildings (accessed on 30 April 2020).
- Chandel, S.S.; Aniket, S.; Bhanu, M. Review of energy efficiency initiatives and regulations for residential buildings in India. Renew. Sustain. Energy Rev. 2016, 54, 1443–1458. [Google Scholar] [CrossRef]
- Economic Commission for Latin America and the Caribbean (ECLAC). Eficiencia Energética en América Latina y el Caribe: Avances y Desafíos del Último Quinquenio. Available online: https://repositorio.cepal.org/bitstream/handle/11362/4106/S2013957_es.pdf?sequence (accessed on 18 November 2020). (In Spanish).
- Interamerican Development Bank, Economic Commission for Latin America and the Caribbean & Latin America Energy Commission. Eficiencia Energética en América Latina y Caribe: Avances y Oportunidades. Available online: https://publications.iadb.org/publications/spanish/document/Eficiencia-energ%C3%A9tica-en-Am%C3%A9rica-Latina-y-el-Caribe-Avances-y-oportunidades.pdf (accessed on 18 November 2020). (In Spanish).
- Palme, M.; Inostroza, L.; Villacreses, G.; Carrasco, C.; Lobato, A. Urban Climate in the South American Coastal Cities of Guayaquil, Lima, Antofagasta, and Valparaíso, and Its Impacts on the Energy Efficiency of Buildings. In Urban Climates in Latin America; Springer: Cham, Switzerland, 2019; pp. 33–63. [Google Scholar]
- Inostroza, L. Informal urban development in Latin American urban peripheries. Spatial assessment in Bogotá, Lima/Santiago de Chile. Landsc. Urban Plan. 2017, 165, 267–279. [Google Scholar] [CrossRef]
- Gallardo, A.; Palme, M.; Beltrán, D.; Lobato, A.; Villacreses, G. Analysis and optimization of the thermal performance of social housing construction materials in Ecuador. In Proceedings of the 32nd International Conference on Passive and Low Energy Architecture. Cities, Buildings, People: Towards Regenerative Environments; Passive and Low Energy Architecture (PLEA): Los Angeles, CA, USA, 2016; pp. 360–366. [Google Scholar]
- Comité Européen de Normalisation (CEN). Standard EN 15251–2007: Indoor Environmental Input Parameters for Design and Assessment of Energy Performance of Buildings Addressing Indoor Air Quality, Thermal Environment, Lighting and Acoustics; British Standards Institution: London, UK, 2007. [Google Scholar]
- Howard, B.; Parshall, L.; Thompson, J.; Hammer, S.; Dickinson, J.; Modi, V. Spatial distribution of urban building energy consumption by end use. Energy Build. 2012, 45, 141–151. [Google Scholar] [CrossRef]
- Fonseca, A.; Schlueter, A. Integrated model for characterization of spatiotemporal building energy consumption patterns in neighborhoods and city districts. Appl. Energy 2015, 142, 247–265. [Google Scholar] [CrossRef]
- Xian-Xiang, L. Linking residential electricity consumption and outdoor climate in a tropical city. Energy 2018, 157, 734–743. [Google Scholar]
- Ang, B.W.; Wang, H.; Ma, X. Climatic influence on electricity consumption: The case of Singapore and Hong Kong. Energy 2017, 127, 534–543. [Google Scholar] [CrossRef]
- Rastogi, M.; Chauhan, A.; Vaish, R.; Kishan, A. Selection and performance assessment of Phase Change Materials for heating, ventilation and air-conditioning applications. Energy Convers. Manag. 2015, 89, 260–269. [Google Scholar] [CrossRef]
- Lira-Oliver, A.; Vilchis-Martínez, R.S. Thermal Inertia Performance Evaluation of Light-Weighted Construction Space Envelopes Using Phase Change Materials in Mexico City’s Climate. Technologies 2017, 5, 69. [Google Scholar] [CrossRef] [Green Version]
- Vega, E.C.; Jara, J.C. Estimación de la evapotranspiración de referencia para dos zonas (costa y región andina) del ecuador. Eng. Agric. 2009, 29, 390–403. (In Spanish) [Google Scholar] [CrossRef]
- Beltrán, R.D.; Martínez-Gómez, J. Analysis of phase change materials (PCM) for building wallboards based on the effect of the environment. J. Build. Eng. 2019, 24, 100726. [Google Scholar] [CrossRef]
- Acurio, K.; Chico-Proano, A.; Martínez-Gómez, J.; Ávila, C.F.; Ávila, Á.; Orozco, M. Thermal performance enhancement of organic phase change materials using spent diatomite from the palm oil bleaching process as support. Constr. Build. Mater. 2018, 192, 633–642. [Google Scholar] [CrossRef]
- Romero, S. Estudio del Confort Térmico Mediante Simulación Validada de una Edificación Tipo con Material de Cambio de Fase en la Envolvente en Varias Zonas Climáticas del Ecuador. Bachelor’s Thesis, Escuela Politécnica Nacional, Quito, Ecuador, 2019. (In Spanish). [Google Scholar]
- Castilho, A.; Sá, A.V.; Abrantes, V. Energy performance of a school building with phase change materials. Sustainable Housing Construction. In Proceedings of the 40th | AHS World Congress on Housing, Funchal, Portugal, 16–19 December 2014. [Google Scholar]
- De Wilde, P. The gap between predicted and measured energy performance of buildings: A framework for investigation. Autom. Constr. 2014, 41, 40–49. [Google Scholar] [CrossRef]
- Gucyeter, B. Calibration of a building performance simulation model via monitoring data. In Proceedings of the 2018 Building Performance Analysis Conference and SimBuild co-organized by ASHRAE and IBPSA-USA, Chicago, IL, USA, 26–28 September 2018. [Google Scholar]
- Harish, V.; Kumar, A. A review on modeling and simulation of building energy systems. Renew. Sustain. Energy Rev. 2016, 56, 1272–1292. [Google Scholar] [CrossRef]
- Vautherot, M.; Maréchal, F.; Farid, M. Analysis of energy requirements versus comfort levels for the integration of phase change materials in buildings. J. Build. Eng. 2015, 1, 53–62. [Google Scholar] [CrossRef] [Green Version]
- Diaz Lozano, P.E.; Vakalis, D.; Touchie, M.; Tzekova, E.; Siegel, J.A. Thermal comfort in multi-unit social housing buildings. Build. Environ. 2018, 144, 230–237. [Google Scholar] [CrossRef]
- Bravo Morales, G.; González Cruz, E. Thermal comfort in naturally ventilated buildings of Maracaibo, Venezuela. Revista Técnica de la Facultad de Ingeniería Universidad de Zulia 2006, 29, 169–181. (In Spanish) [Google Scholar]
- Esbati, S.; Amooie, M.A.; Sadeghzadeh, M.; Ahmadi, M.H. Investigating the effect of using PCM in building materials for energy saving: Case study of Sharif Energy Research Institute. Energy Sci. Eng. 2019, 8, 959–972. [Google Scholar] [CrossRef] [Green Version]
- ANSI/ASHRAE Standard 55-2017. Thermal Environmental Conditions for Human Occupancy; ANSI: New York, NY, USA, 2017; ISSN I041-2336. [Google Scholar]
- Ministerio de energía y recursos naturales no renovables. Balance Energético Nacional, 1st ed.; Ministerio de Energía y Recursos Naturales no Renovables: Quito, Ecuador, 2020; pp. 18–26. [Google Scholar]
- Palme, M.; Lobato, A.; Gallardo, A.; Beltrán, D.; Kastillo, J.; Villacreses, G.; Godoy, F. Estrategias Para Mejorar las Condiciones de Habitabilidad y el Consumo de Energía en Viviendas, 1st ed.; Instituto de Investigación Geológico y Energético: Quito, Ecuador, 2018. (In Spanish) [Google Scholar]
- Ficha informativa de proyecto. Plan Master del Programa Habitacional Socio Vivienda. Memoria Descriptiva, Rediseño Urbanísitco Etapas 1 y 2. Available online: https://www.habitatyvivienda.gob.ec/wp-content/uploads/downloads/2018/04/Socio-Vivienda.pdf (accessed on 30 April 2020).
- Informe de Gestión Correspondiente al mes de Noviembre de 2018. Available online: https://www.habitatyvivienda.gob.ec/wp-content/uploads/downloads/2018/12/Gestion-Subsecretaria-de-Habitat-y-Espacio-Publico.pdf (accessed on 30 April 2020).
- Actualización de prioridad del proyecto: “Socio vivienda”. MIDUVI. Available online: https://www.habitatyvivienda.gob.ec/wp-content/uploads/downloads/2015/06/PROYECTO-SOCIO-VIVIENDA.pdf (accessed on 30 April 2020).
- Pliego Tarifario Para las Empresas Eléctricas de Distribución. Available online: https://www.regulacionelectrica.gob.ec/resoluciones-pliegos-tarifarios/ (accessed on 27 April 2020).
- Geoportal-CNEL Online Version. Available online: https://geoportal.cnelep.gob.ec/cnel/ (accessed on 27 April 2020).
- Devore, J. Probability & Statistics for Engineering and the Sciences, 8th ed.; Julet, M., Ed.; Brooks/Cole: Pacific Grove, CA, USA, 2010; pp. 92–136. [Google Scholar]
- Portfolio Manager Technical Reference Climate and Weather U.S. Available online: https://www.energystar.gov/buildings/tools-and-resources/portfolio-manager-technical-reference-climate-and-weather (accessed on 27 April 2020).
- Norma Ecuatoriana de la Construcción. Eficiencia Energética en Edificaciones Residenciales NEC-HS-EE. Available online: https://www.habitatyvivienda.gob.ec/wp-content/uploads/downloads/2019/03/NEC-HS-EE-Final.pdf (accessed on 30 April 2020).
- Lee, S.; Macías, J.; Soriano, G.; Lobato-Cordero, A. Application of high solar reflectance roofs in low-income dwellings in Guayaquil: A case study for the program “Socio Vivienda 2”. In Proceedings of the Congreso INER I+D+i, Quito, Ecuador, 25 February 2019. [Google Scholar]
- Vallejo-Coral, E.C.; Rivera-Solorio, C.I.; Gijón-Rivera, M.; Zúñiga-Puebla, H.F. Theoretical and experimental development of cooling load temperature difference factors to calculate cooling loads for buildings in warm climates. Appl. Therm. Eng. 2018, 150, 576–590. [Google Scholar] [CrossRef]
- Gaudry, K.H.; Godoy-Vaca, L.; Espinoza, S.; Fernández, G.; Lobato-Cordero, A. Normativas de energía en edificaciones como estrategia de mitigación al cambio climático. ACI Av. Cienc. Ing. 2019, 11. [Google Scholar] [CrossRef] [Green Version]
- Beltran, R.D. Life Cycle Assessment of Household Air Conditioning Systems-the Case of Ecuador. Master’s Thesis, Budapest University of Technology and Economics Faculty of Mechanical Engineering, Budapest, Hungary, 2018. [Google Scholar]
- ASHRAE Guideline 14-2014. Measurement of Energy, Demand, and Water Savings; ASHRAE: Atlanta, GA, USA, 2014; ISSN 1049-894X. [Google Scholar]
- Kosny, J. PCM—Enhanced Building Components; An Application of Phase Change Materials in Building Envelopments and Internal Structures; Springer: Berlin/Heidelberg, Germany, 2015; ISSN 1619-0181. [Google Scholar]
- BioPCM Q29 Tunable Physical and Chemical Properties. Available online: https://phasechange.com/wp-content/uploads/2018/02/BioPCM-Data-Sheet-Q29.pdf (accessed on 30 April 2020).
- Chang, S.J.; Wi, S.; Lee, J.; Kim, S. Thermal performance analysis of phase change materials composed of double layers considering heating and cooling period. J. Ind. Eng. Chem. 2019, 72, 255–264. [Google Scholar] [CrossRef]
- Rubitherm RT25HC. Available online: https://www.rubitherm.eu/media/products/datasheets/Techdata_-RT25HC_EN_15012020.PDF (accessed on 3 March 2020).
- Li, X.; Zhou, Y.; Yu, S.; Jia, G.; Li, H.; Li, W. Urban heat island impacts on building energy consumption: A review of approaches and findings. Energy 2019, 174, 407–419. [Google Scholar] [CrossRef]
- Flores-Larsen, S.; Filippín, C. Energy efficiency, thermal resilience, and health during extreme heat events in low-income housing in Argentina. Energy Build. 2021, 231, 110576. [Google Scholar] [CrossRef]
- Guichard, S.; Miranville, F.; Bigot, D.; Malet-Damour, B.; Beddiar, K.; Boyer, H. A complex roof incorporating phase change material for improving thermal comfort in a dedicated test cell. Renew. Energy 2017, 101, 450–461. [Google Scholar] [CrossRef]
- Ahangari, M.; Maerefat, M. An innovative PCM system for thermal comfort improvement and energy demand reduction in building under different climate conditions. Sustain. Cities Soc. 2019, 44, 120–129. [Google Scholar] [CrossRef]
- Figueiredo, A.; Vicente, R.; Lapa, J.; Cardoso, C.; Rodrigues, F.; Kämpf, J. Indoor thermal comfort assessment using different constructive solutions incorporating PCM. Appl. Energy 2017, 208, 1208–1221. [Google Scholar] [CrossRef]
- Bhikhoo, N.; Hashemi, A.; Cruickshank, H. Improving Thermal Comfort of Low-Income Housing in Thailand through Passive Design Strategies. Sustainability 2017, 9, 1440. [Google Scholar] [CrossRef] [Green Version]
- Costanzo, V.; Evola, G.; Marletta, L.; Nocera, F. The effectiveness of phase change materials in relation to summer thermal comfort in air-conditioned office buildings. Build. Simul. 2018, 11, 1145–1161. [Google Scholar] [CrossRef]
- Marin, P.; Saffari, M.; De Gracia, A.; Zhu, X.; Farid, M.M.; Cabeza, L.F.; Ushak, S. Energy savings due to the use of PCM for relocatable lightweight buildings passive heating and cooling ind different weather conditions. Energy Build. 2016, 129, 274–283. [Google Scholar] [CrossRef] [Green Version]
- Younes, C.; Shadid, C.A.; Bitsuamlak, G. Air infiltration through building envelopes: A review. J. Build. Phys. 2011, 35, 267–302. [Google Scholar] [CrossRef]


| Quantity of Households | Fee | Mean Energy Consumption [kWh-Month] (2013–2018) |
|---|---|---|
| 1266 | Commercial, PEC, and others | 319.5 |
| 890 | Only Residential | 135.96 |
| Element | Material | Thermal Conductivity [W/m °C] | Density [kg/m3] | Specific Heat [J/kg °C] | Solar Absortance [37,38] | Emisivity | Thickness [mm] [7] | Solar Transmittance [7,39] | Solar Heat Gain Coefficient (SHGC) [7] | U-Value [W/M2 k] [7] |
|---|---|---|---|---|---|---|---|---|---|---|
| Roof | Surface | 0.41 | 1251 | 1086 | 0.78 | 0.5 | 0.1 | 2.96 | ||
| Metal slab | 160 | 2800 | 880 | 0.3 | 0.3 | 3 | ||||
| Internal Insulation | 0.04 | 91 | 836 | 0.6 | 0.9 | 8 | ||||
| Wall | Plaster external (white color) | 0.7 | 2778 | 840 | 0.2 | 0.9 | 5 | 3.694 | ||
| Concrete block | 0.81 | 977 | 837 | 0.6 | 0.9 | 70 | ||||
| Plaster internal (white color) | 0.7 | 2778 | 840 | 0.2 | 0.9 | 5 | ||||
| Window | Single clear glazing | 0.9 | 0.84 | 3 | 0.837 | 0.861 | 5.894 | |||
| External door | Metal door | 16 | 3.124 | |||||||
| Floor | Ceramic/clay tiles | 0.8 | 1700 | 850 | 0.6 | 0.9 | 4 | 2.22 | ||
| Cast concrete | 1.13 | 2000 | 1000 | 0.6 | 0.9 | 70 | ||||
| Earth, gravel | 0.52 | 2050 | 180 | 0.6 | 0.9 | 90 |
| Year | Low [kWh] | Medium [kWh] | High [kWh] | |||
|---|---|---|---|---|---|---|
| Σ | M | Σ | M | Σ | M | |
| 2013 | 430 | 39 | 1283 | 94 | 3814 | 312 |
| 2014 | 759 | 64.5 | 1855 | 127 | 2984 | 250.5 |
| 2015 | 670 | 56.5 | 2078 | 163 | 4819 | 401.5 |
| 2016 | 680 | 57.5 | 2120 | 169 | 6969 | 549 |
| 2017 | 564 | 47.5 | 2367 | 198 | 6127 | 474 |
| 2018 | 493 | 41 | 2687 | 232.5 | 6008 | 470 |
| Average annual consumption [kWh/y] | 600 | 2065 | 5120 | |||
| Activity | Schedule | Value | ||
|---|---|---|---|---|
| Low | Medium | High | ||
| Occupation | Weekdays 0:00–7:00 100% 7:00–11:00 75% 11:00–18:00 0% 18:00–0:00 100% Weekends and holidays 0:00–24:00 100% | 0.0196 pers/m2 | 0.04 pers/m2 | 0.04 pers/m2 |
| Equipment and lighting | 2.16 W/m2 + 1 W/m2 | 2.16 W/m2 + 3.3 W/m2 | 2.16 W/m2 + 5 W/m2 | |
| Infiltration | 3 renov/hr | 3 renov/hr | 3 renov/hr | |
| A/C set-point temperature | 27 °C | None | 25 °C | |
| Ventilation | All day | 1 renov/hr | 1 renov/hr | 1 renov/hr |
| Monthly Energy Consumption | CV (RMSE) | NMBE |
|---|---|---|
| High consumption household | 8.4 | 3.2 |
| Medium consumption household | 14.87 | 2.2 |
| Low consumption household | 10.77 | 2.4 |
| Temperature [°C] | CV (RMSE) | NMBE | Absolute Average Error (°C) | R | |
|---|---|---|---|---|---|
| Roof | Interior | 11.71 | 10.68 | 3.12 | 0.91 |
| Exterior | 16.54 | 12.78 | 3.89 | 0.83 | |
| Wall | Interior | 2.49 | 2.15 | 0.6 | 0.95 |
| Exterior | 4.19 | 3.36 | 0.92 | 0.95 | |
| Air temperature | Interior | 2.28 | 1.77 | 0.5 | 0.91 |
Publisher’s Note: MDPI stays neutral with regard to jurisdictional claims in published maps and institutional affiliations. |
© 2021 by the authors. Licensee MDPI, Basel, Switzerland. This article is an open access article distributed under the terms and conditions of the Creative Commons Attribution (CC BY) license (http://creativecommons.org/licenses/by/4.0/).
Share and Cite
Godoy-Vaca, L.; Vallejo-Coral, E.C.; Martínez-Gómez, J.; Orozco, M.; Villacreses, G. Predicted Medium Vote Thermal Comfort Analysis Applying Energy Simulations with Phase Change Materials for Very Hot-Humid Climates in Social Housing in Ecuador. Sustainability 2021, 13, 1257. https://doi.org/10.3390/su13031257
Godoy-Vaca L, Vallejo-Coral EC, Martínez-Gómez J, Orozco M, Villacreses G. Predicted Medium Vote Thermal Comfort Analysis Applying Energy Simulations with Phase Change Materials for Very Hot-Humid Climates in Social Housing in Ecuador. Sustainability. 2021; 13(3):1257. https://doi.org/10.3390/su13031257
Chicago/Turabian StyleGodoy-Vaca, Luis, E. Catalina Vallejo-Coral, Javier Martínez-Gómez, Marco Orozco, and Geovanna Villacreses. 2021. "Predicted Medium Vote Thermal Comfort Analysis Applying Energy Simulations with Phase Change Materials for Very Hot-Humid Climates in Social Housing in Ecuador" Sustainability 13, no. 3: 1257. https://doi.org/10.3390/su13031257