
Feature Selection in Energy Consumption of Solar Catamaran INER 1 on Galapagos Island


1
Technology Transfer and Incubation Department, Instituto de Investigación Geológico y Energético (IIGE), Quito 170518, Ecuador
2
Facultad de Ingeniería y Ciencias Aplicadas, Universidad Internacional SEK, Quito 170302, Ecuador
3
Department of Signal Theory and Communication, Mechanical Engineering Area, Universidad de Alcalá, 28801 Madrid, Spain
*
Author to whom correspondence should be addressed.
Energies 2022, 15(8), 2761; https://doi.org/10.3390/en15082761
Submission received: 10 December 2021
/
Revised: 17 January 2022
/
Accepted: 23 January 2022
/
Published: 9 April 2022
(This article belongs to the Special Issue Electric and Hybrid Vehicles: Technology Trends, Challenges and Opportunities)
Abstract
:Maritime passenger transport in the Galapagos Islands–Itabaca Channel is based on boats with combustion engines that consume an annual average of 4200 gallons of fuel and produce about 38 tons of CO2 per year. The operation of the solar catamaran “INER 1” electric propulsion (PV) is a renewable and sustainable model for passenger shipping in the Galapagos Islands. In this regard, the detailed study of the relationship between the variability of solar radiation, the abrupt change of tides due to changes in wind speed and direction, and the increase in tourists, according to dry and wet seasons, cause high energy consumption. The boats must absorb energy from the electrical grid of the islands; this energy is from renewable (solar and wind) and, mostly, of fossil origin so identifying the source of the energy absorbed by the boats is essential. The aim of this study was to select the most influential attributes in the operation of the solar catamaran “INER 1” in the Galapagos Islands. The methodology for knowledge discovery in the databases was determined by selecting attributes that combine environmental, social, and energy variables affecting the energy performance of the solar catamaran. The energy consumption of the boats features a direct relationship with the attributes defined in this research as: (1) Energ (energy used), (2) Tur (tourists and residents), (3) Fotov (PV park), (4) Glrad (global radiation), (5) date (date and time), (6) Term9 (thermo-electric 9). Considering the six best attributes filtered by the proposed algorithms, 4.95% in the mean squared error parameter and a 98.94% accuracy in the classification and prediction of the energy consumed by boats were obtained.
1. Introduction
Increased quality of life and longevity in humans has led to exponential population growth over the past 200 years. This has generated great benefits for humanity but has also generated great damage to ecosystems, natural resources, and the environment in general [1]. One of the biggest problems is human activity, which creates a large amount of emissions of greenhouse gases, chemicals that affect the ozone layer, and waste that cannot be reused [2].
In recent decades, human beings have placed great importance on caring for renewable and non-renewable energy resources and protecting the environment. In this sense, they have tried to identify and mitigate the environmental impact generated by the production and manufacture of technology [2]. Several methodologies have been developed to identify and mitigate environmental impact. One of the most frequently used methodologies is life cycle analysis (LCA) due to its standardization and easy application [3].
In particular, according to [4], the current economic system is based on the use of vessels destined for the transport of passengers, primary, intermediate, and finished products. In this way, a boat provides its services, and although it generates income for the owner, at the same time, it generates environmental effects, such as emissions from combustion and fuel residues disposed of in the environment. Moreover, in the final phase of use, that is, in the dismantling, there are significant impacts on the environment and on the people involved.
On the other hand, boats with electric propulsion systems have experienced important technological developments in recent years. For example, a boat called Sun21, which arrived in New York in 2007, was the first boat with electric propulsion using only solar energy to cross the Atlantic ocean with an approximate route of 11,000 km, saving approximately 4000 L of diesel [5]. Subsequently, in 2012, the “MS Tûranor PlanetSolar” concluded a 584 day tour around the world, reaching a new record. However, the boat was optimized to break its own records and crossed the Atlantic in 22 days in 2013 [6].
In addition, according to [7], a transport model based on electrical energy generated through hydrogen, either by electrolysis or through supply stations, would reduce greenhouse gas emissions by 0.6–2.2 gCO2/MJ in Europe and between 6.0–17.7 gCO2/MJ in the United States. This difference could be explained because countries that possess an energy matrix based on renewable energy perform better in the proposed life cycle analysis with the same policies in both scenarios.
According to [8], life cycle analysis on vessels allows the identification of the impacts associated with electrical generation systems and auxiliary generators. Thus, it is possible to improve the manufacturing and operation processes of vessels by following the life cycle analysis methodology.
The Galapagos Islands feature a sensitive economy that is based on tourism. Therefore, a large number of national and foreign tourists visit the islands and require sea transportation between them [9]. According to [10], in 2015, 70,451 national passengers and 154,304 foreign passengers entered the Galapagos Islands. Of the total of passengers who entered 173,487, 77% entered through Baltra airport and the remaining 51,116 passengers, 23%, through the island of San Cristóbal. Visits by tourists to the islands are determined by two seasons: warm and rainy, which runs from January to June, and dry and cold, which starts in July and ends in December of each year. There are two tourist seasons in the islands, which are known as the high season, spanning the months of January, June, July, August, and December, with an average of 19,370 visitors; and the low season, running through February, March, April, May, September, October, and November, with an average of 18,022 [11].
In June 2014, the first solar electric boat, called Solaris, which was developed by the Directorate of the Galapagos National Park (GNP) in coordination with the World Wide Fund for Nature (WWF), was operated in the Galapagos Islands [12]. Its size was designed considering its total weight of 1800 kg and use over 1.5 h per day and daily travel distance of 7.6 km, which represents a round trip on a tour of the Tintoreras on Isabela Island. Its implementation shows the interest of Ecuador and the world in developing and implementing environmentally friendly technologies [13].
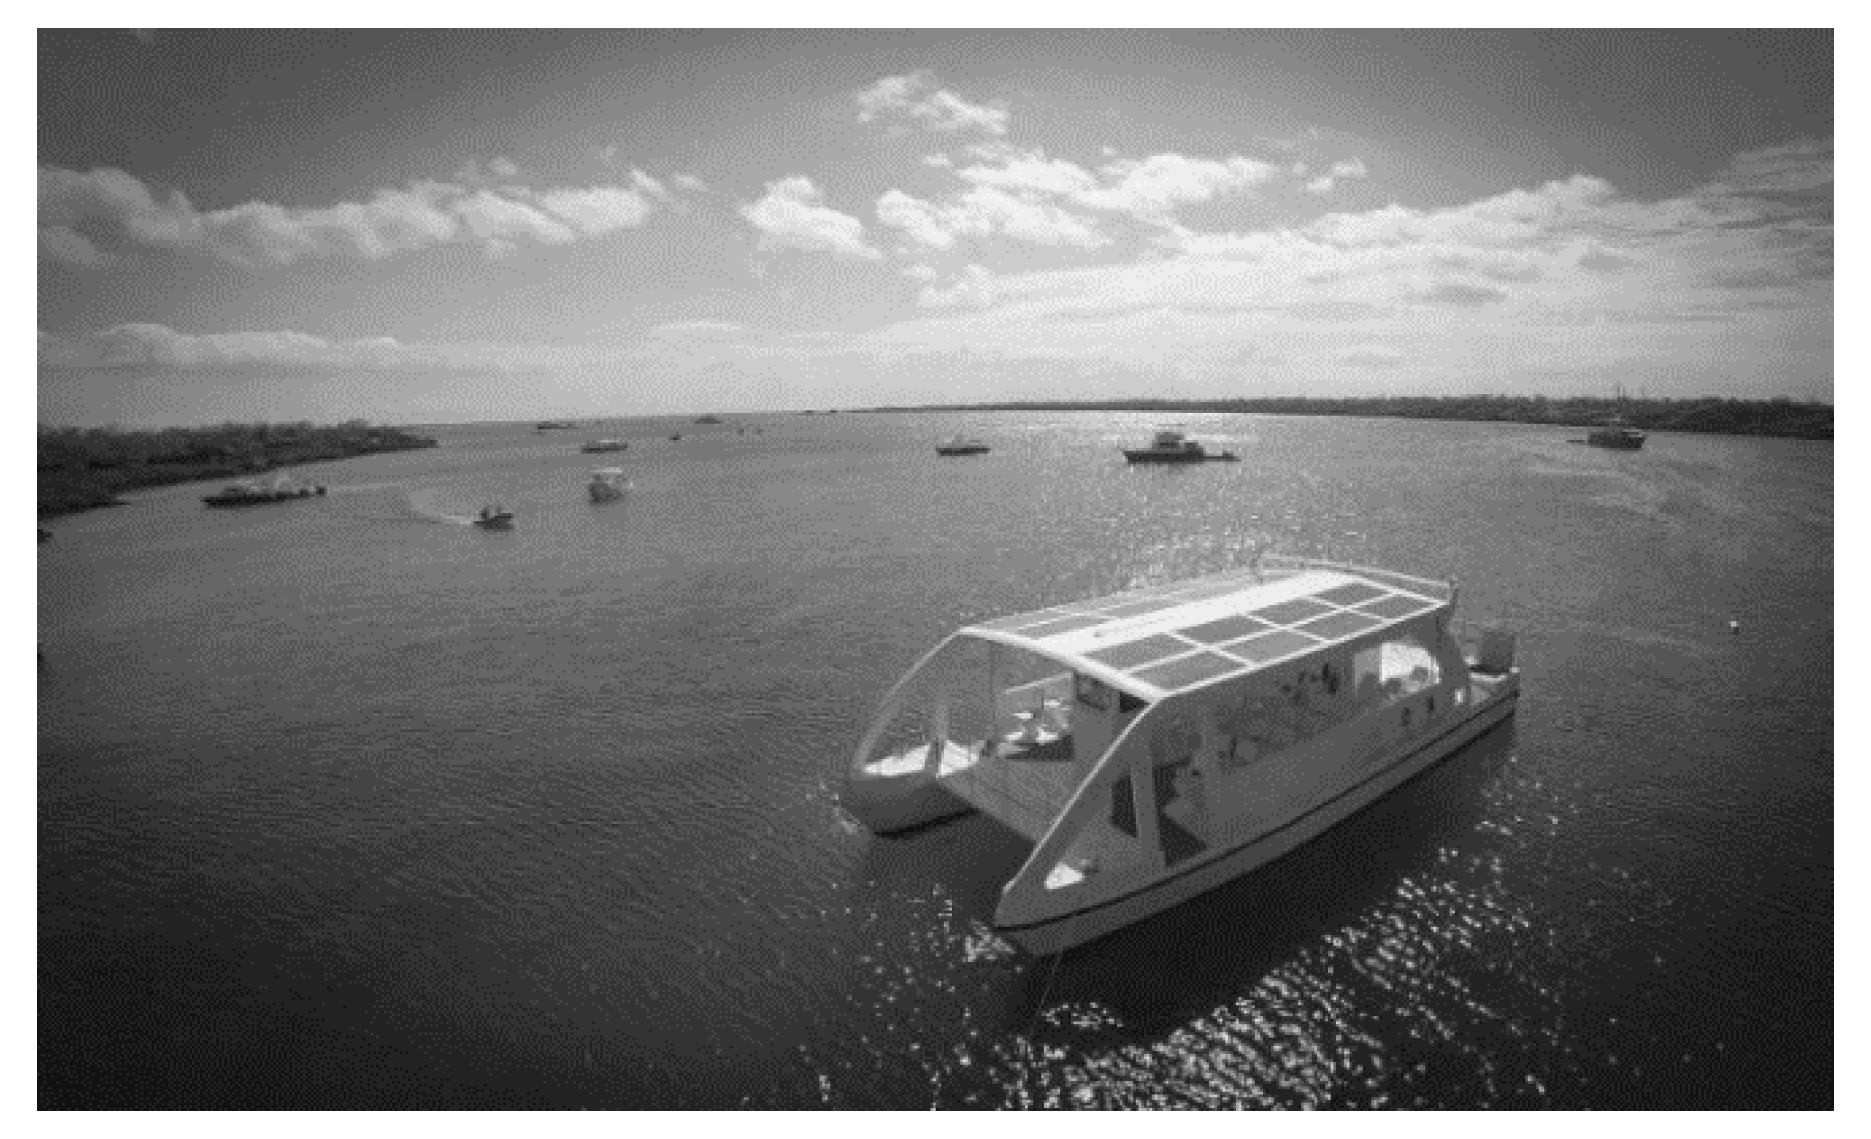
To reduce the environmental damage that human beings are creating, a sustainable and renewable model was implemented for the maritime transport of passengers in the Islands. A catamaran prototype powered by electric motors functioning with solar energy, which is responsible for transporting passengers from the Baltra Island airport to Santa Cruz Island through the Itabaca channel, replaced conventional barges, which are polluters. The INER 1 solar catamaran shown in Figure 1 can transport a maximum of forty seated passengers and two in wheelchairs, with their respective luggage, along eight routes of 0.6 km each. It features an installed photovoltaic power of 4.2 kWp with a storage capacity of 11.5 kWh @ 2 h and a maximum consumption of 3 kWh per day from the Baltra Island electricity grid, which is based on wind energy. The Itabaca channel, where the vessel carries out its passenger transport activity, features an average direct solar radiation of 600 Wh/m2 [14,15].
One of the biggest problems associated with renewable energies is the intermittency of their sources, which prevents the penetration of said energy into power systems [16]. To counteract this restriction, various prediction methods have been developed and analyzed in terms of their performance, according to the type of technology in which the application is required. These prediction systems allow the estimation of the amount of energy that a renewable source can produce in certain production conditions and scenarios [17].
According to [18], obtaining climatological parameters in places where there is no access to a meteorological station, such as the the Galapagos Islands, is possible through the Meteonorm platform. The calculations made through this platform are based on database averages of around 8000 meteorological stations around the world and five geostationary satellites, over periods greater than 10 years.
For solar radiation, the system provides the maximum values in conditions where the sky is clear [19]. According to [20], the comparisons between the solar radiation values sampled for longer periods show a variation of less than 2% for all meteorological stations. Nonetheless, the mathematical computational models show a smaller error than the variation in the total radiation measured between one year and another.
The meteorological data derived from the Meteonorm platform feature very small deviations, since their models use average data from the period between 1985 and 2005. This allows the analysis of photovoltaic systems with high precision, since the performance presented in the simulation ranges from 5754 and 5771 kWh/year. In addition, the actual data measured by the solar inverter of the photovoltaic installation are 5755 kWh/year, with a 3% variation between the measured data and the data generated by the platform [21].
2. Experimental Methods
2.1. Data Mining
In terms of the analysis of the behavior of climatological, energetic, and social variables, the variable selection method is also known as the identification of the most important input parameters in a system. This analysis method allows the improvement of the prediction capacity of its most important variables. This problem has been extensively investigated in the fields of computing and machine learning, where it is called the feature selection problem (FSP) [17].
Feature selection is a part of all the techniques used in data mining. Its general concept consists of applying various analysis methodologies in large volumes of information to find the most useful and applicable, and not random. Therefore, data mining is responsible for searching relationships and patterns among all the largest amounts of data or data sets available to analyze [22]. A pattern is the representation of a trend in repeating data that is obtained from a database or information source. Furthermore, the definition of a pattern is based on its adaptability to a large amount of data and the ease of relating to it [23].
The feature selection method consists of filtering the most relevant characteristics of the main data set that best describes the behavior of all its objects. Its function is to reduce the dimensions of the database. Thus, discarding the information that is not relevant or redundant for the representation of the information makes it possible to reduce the computational cost and to generalize the learning algorithm in its initial stage [24,25,26].
2.1.1. Information Pre-Processing
The creation and management of a database, where all the collection of both auxiliary and main variables historically generated with the process of identification of parameters is stored, is one of the processes that demands a higher priority due to the statistical analyses required [27]. The ordered and filtered variables must be treated by using specialized data mining software In this case, the use of the free software WEKA (Waikato Environment for Knowledge Analysis), developed by the University of Waikato Hamilton, New Zealand is proposed [28].
2.1.2. Artificial Neural Networks
A data classification algorithm allows the ordering and predicting of the general behavior of a data set to which it belongs by analyzing the relationships between the data and estimating statistical data, such as means, relative error, absolute error, and variances [29].
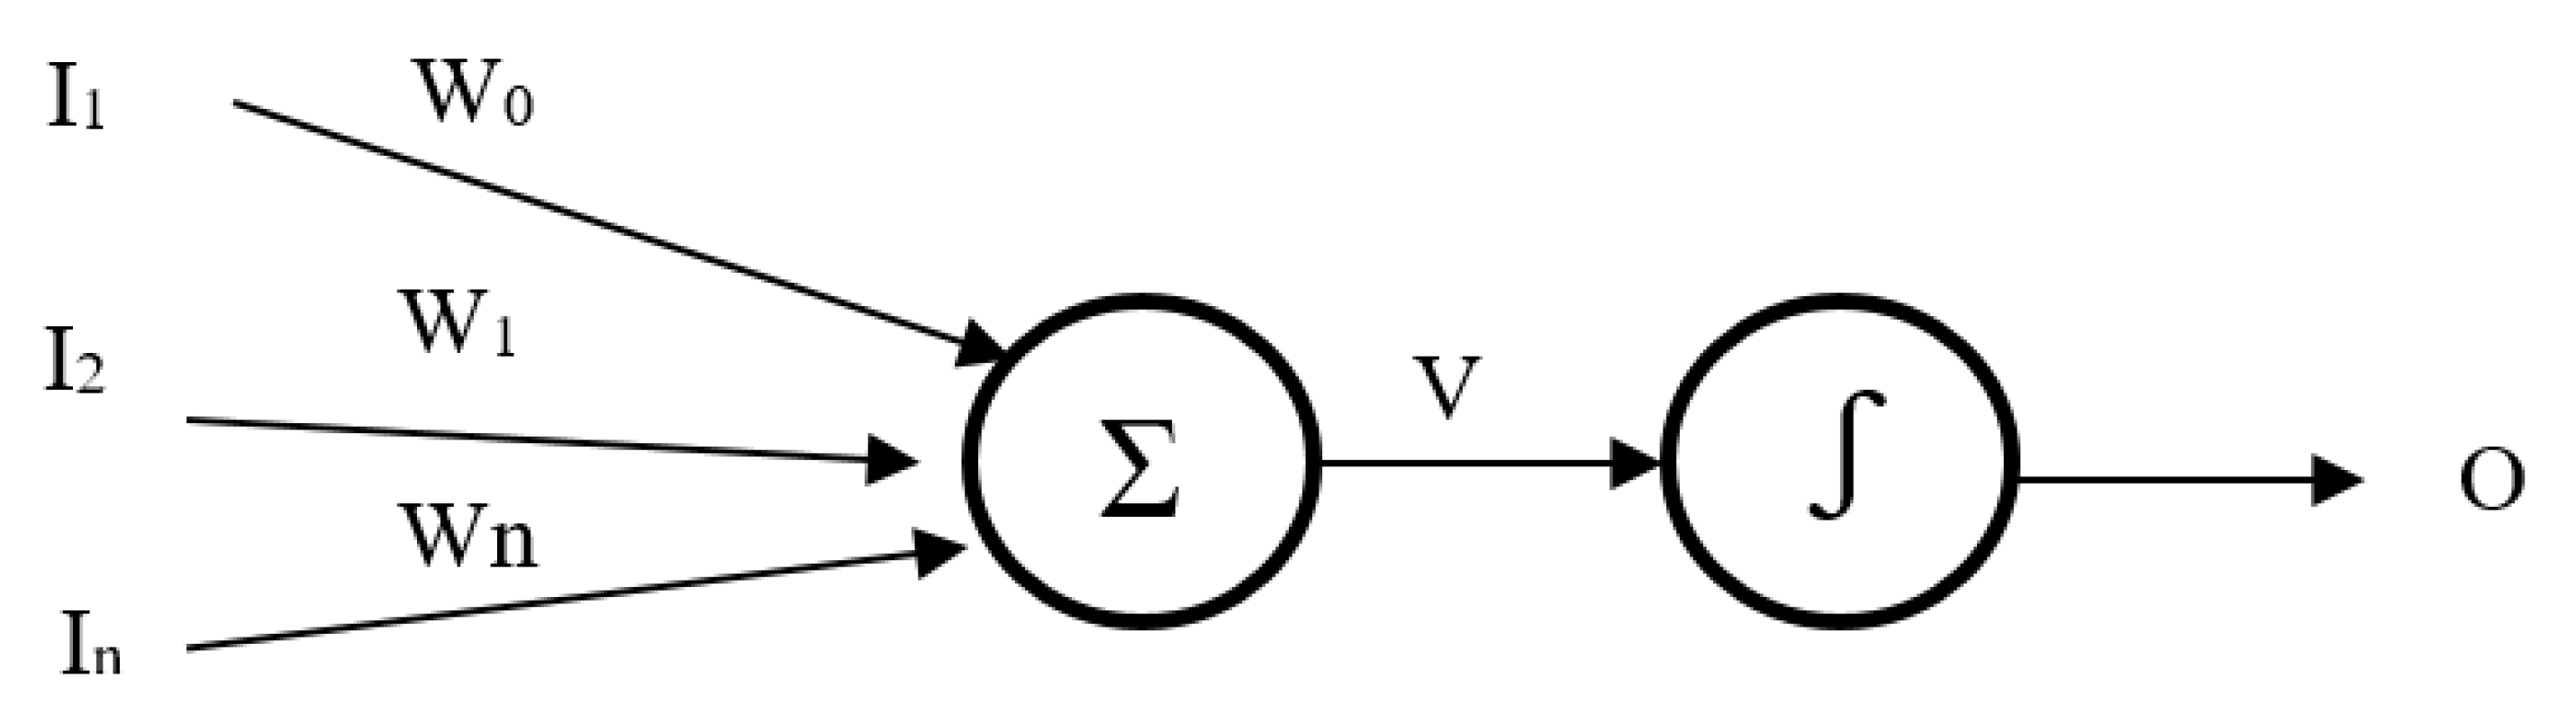
A perceptron is the simplest unit of a neural network and can be used for classifying linearly separable classes or concepts. Its operation consists of the weighted sum (activation function) of the inputs multiplied by a weight in each of them, as can be seen in Equation (1) [30].
where w(x) is the neural network output, wi is the synaptic weight, xi is the input data, and Σ represents the activation function.
The conceptualized model of a perceptron of In inputs, Wn weights, its activation function, and an output O is presented in Figure 2. The learning of the perceptron consists of generating the weights of each of the inputs and the value of the threshold weight. The perceptron training rule is used to show the convergence to a given solution of steps if the classes are linearly separable.
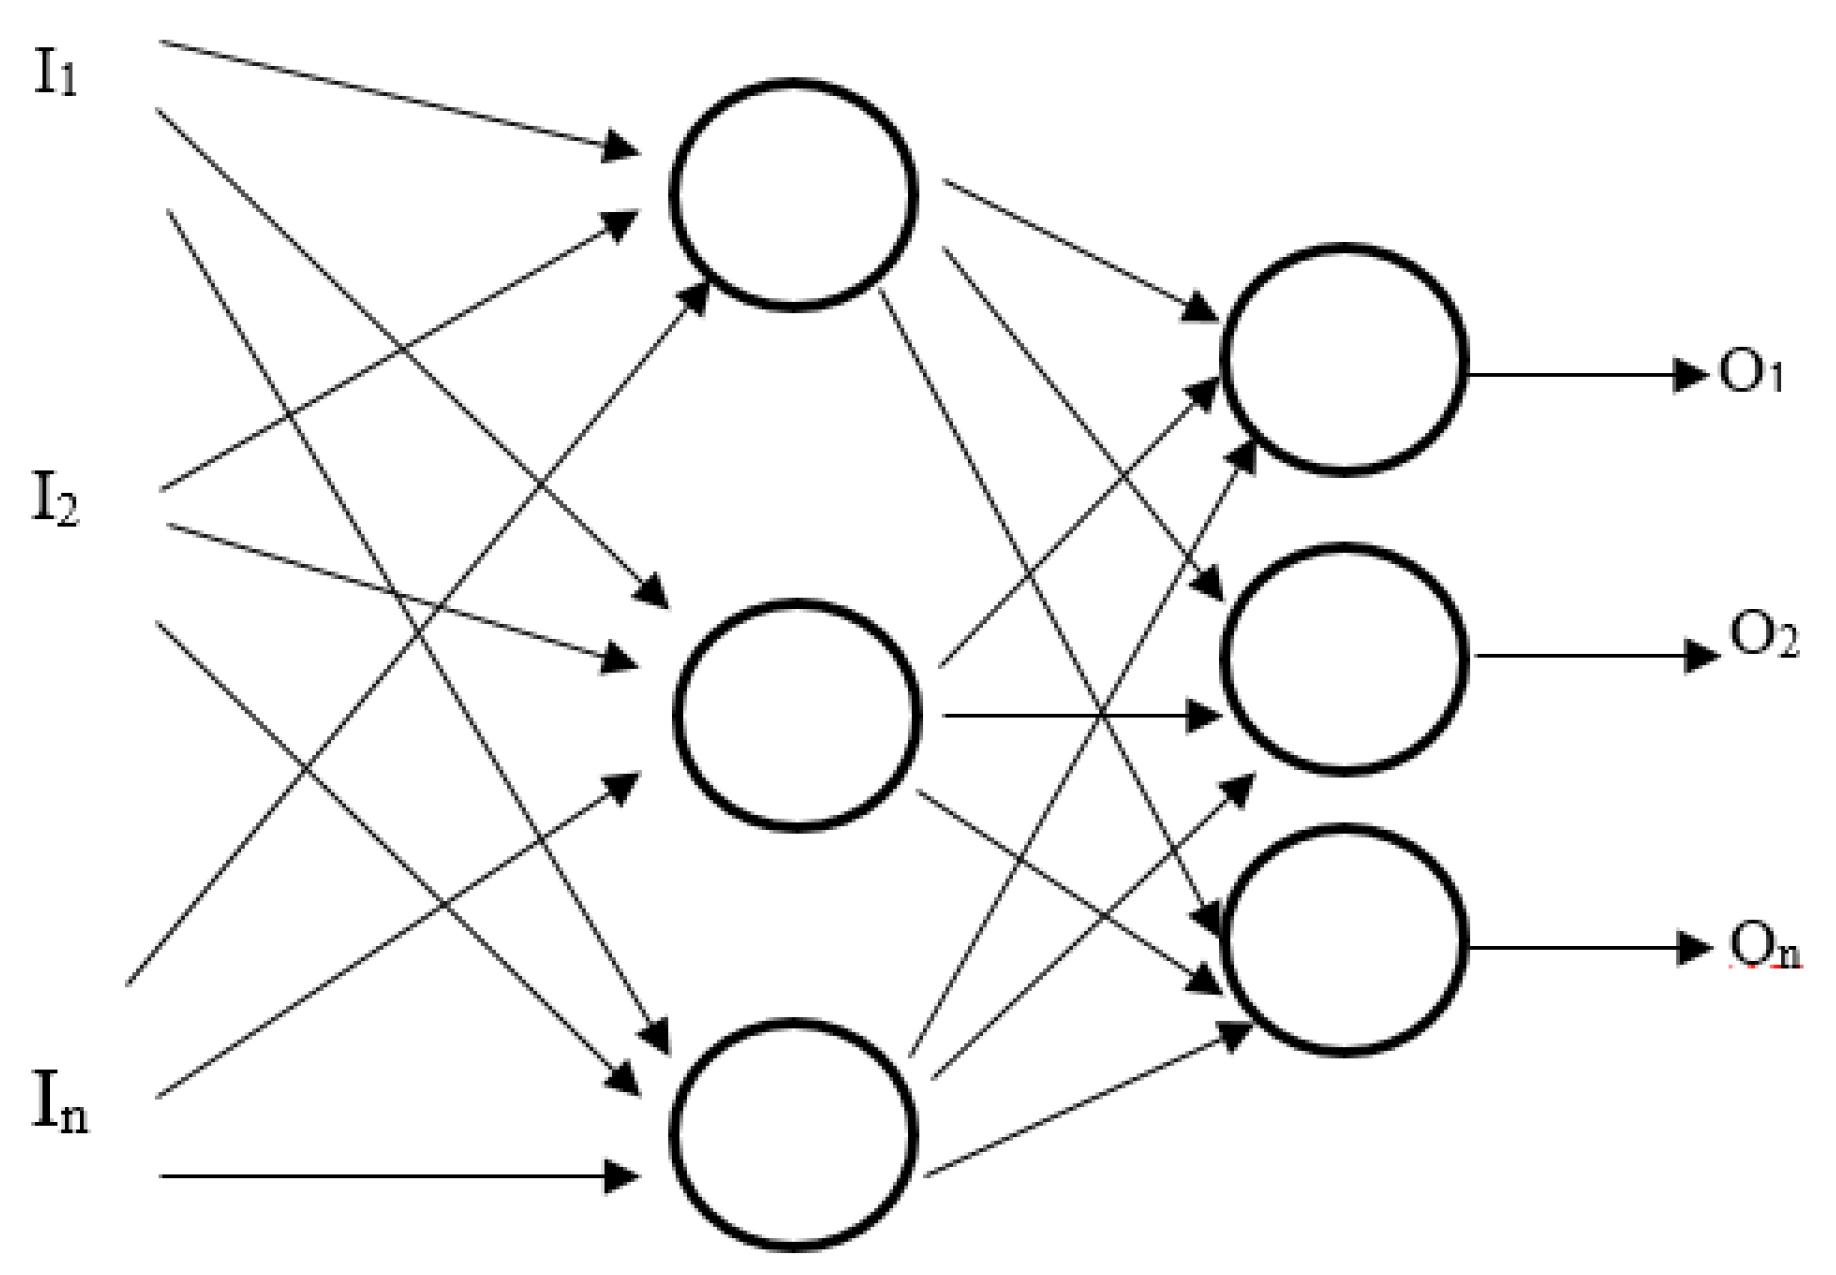
The single perceptron layer is solvable only if the classes are linearly separable when a kind of data classification is not using a configuration required for the neural network multilayer perceptron type, whose structure is shown in Figure 3.
The most widely used learning algorithm in the multilayer perceptron network is the back propagation of the error, known as backpropagation, which uses the sum of the squared errors of the sample values as the optimizing value, as shown in Equation (2).
where o is the network output based on the test values, y is the expected output, and w represents the synaptic weights of the neural network.
2.2. Solar Ship INER 1
Renewable energies are used extensively in some applications; one of them is maritime transport systems. Despite its benefits in this particular case of solar and photovoltaic energy, there are different technical, environmental, energy, and social reasons that must be studied. Being a limitation on its use, one of these factors, perhaps the most important, is the intermittency of the solar resource that prevents solar systems from playing a fundamental role in the sustainable development of, in this case, maritime passenger transport [19].
The intermittency of solar sources requires precise prediction systems that allow the estimation and adequate management of renewable energy. In particular, the INER 1 vessel uses a recharging station that is connected to the electrical network of the Galapagos Islands, Santa Cruz, where there are renewable generation systems (solar and wind) and thermoelectric generation. Furthermore, the variability of climatological and environmental parameters, such as wind speed and direction, temperature, humidity, solar radiation, and tides, require the identification of the variables of most significant weight affecting the energy efficiency in the operation of the solar ship INER 1 [31].
According to [14], there is a deficient use of energy, mostly from fossil fuels, in the maritime transport of passengers in the Itabaca channel because, on average, conventional vessels consume 4200 gallons of fuel annually and produce an emanation of 38 tons of CO2 per year considering that the used fuel is transported from the mainland to the Galapagos province. Therefore, a solution to this problem is the development of sustainable means of transport based on renewable energies, specifically solar energy, due to the many resources present on the Galapagos Islands [32].
2.3. Meteorological Parameters
According to [33], the meteorological variables to consider for an attribute selection study should be global solar radiation, ambient temperature and humidity, wind speed and direction, data that can be generated through Meteonorm software [34], along with the compilation of tide tables found in the digital repository of the Navy Oceanographic Institute [35]. According to [36], the twelfth method makes it possible to obtain intermediate data between high and low tide values using the sinusoidal behavior of the sea to approximate their values to an hourly measurement.
2.4. Energy Parameters
The data necessary to analyze the energy performance of a photovoltaic solar installation requires the generation of energy from the complete electrical network considering all the possible technologies, the photovoltaic energy generated by the system and absorbed by the installation’s battery bank, and the photovoltaic energy delivered for consumption or synchronization to the electrical grid. These parameters must be measured and recorded at one-hour intervals. The relevant information regarding the electrical generation of other generation systems, such as wind power plants, thermoelectric plants, hydroelectric plants, among others, must be considered [19].
2.5. Social Parameters
Human movements, such as migration and internal or external tourism, that can affect the behavior of the boat in a given period of time, are considered as social variables [37]. This information is available from the Directorate of the Galapagos National Park in the annual visitor reports published in 2017, with the base year 2016 [11], with a total of 218,365 internal or external tourist arrivals and movements typical of the population of the islands.
Entry to the Galapagos Islands is undertaken by air. Three companies (TAME, LAN, Avianca) manage the flight frequencies of both arrivals and departures in a schedule from 9:00 a.m. to 4:00 p.m., with approximately one flight per hour following the route taken by the people who arrive on the Island of Baltra to reach Santa Cruz.
According to the seasonal climate of the Galapagos Islands, the highest income from tourists is in the dry and wet seasons, which are the most desired by local and international tourist industries. These stations are accompanied by a variation in solar radiation, abrupt changes in the tides, and variation in the speed and direction of the wind. These conditions cause an increase in the energy consumption of the INER 1 photovoltaic solar boat. The main objective is the identification of one or several combinations of energy, environmental, or social variables that could affect the energy performance of solar boats.
3. Methodology
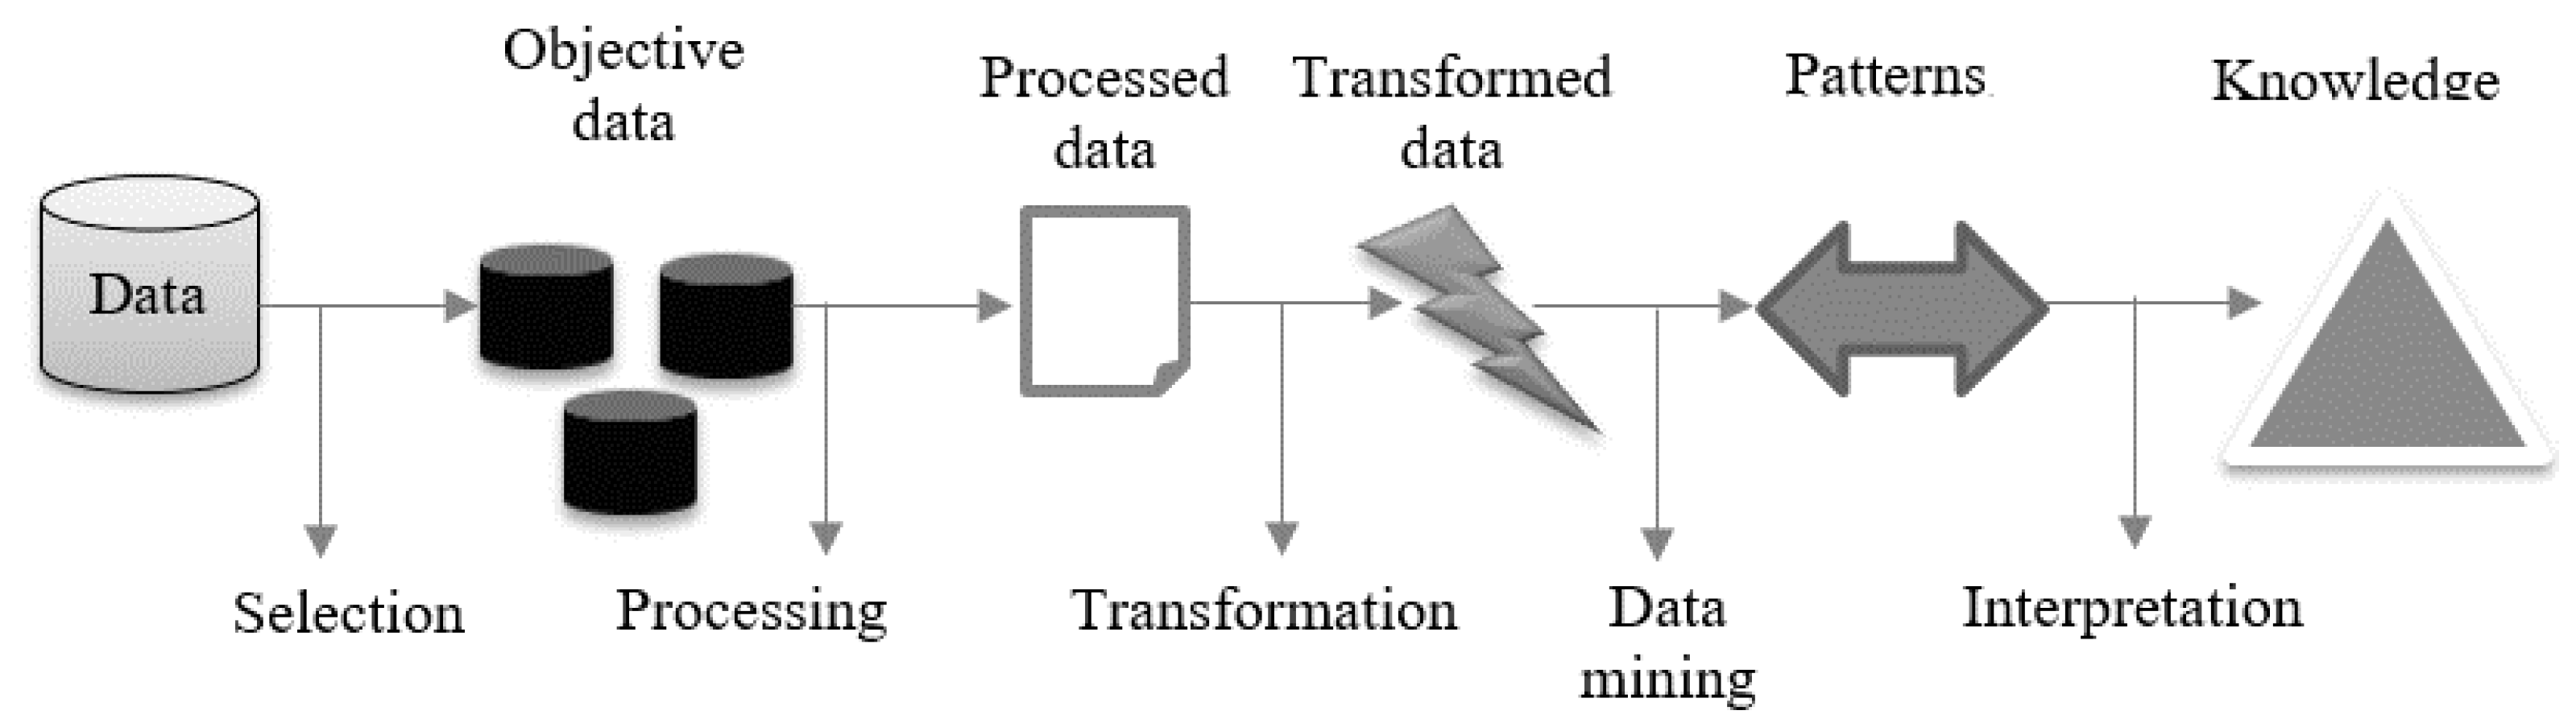
The methodology selected for the development of the research is used by [31]. This study is based on knowledge discovery in databases (KDD). This concept features a multi-step process to identify patterns in databases that allow the identification of new information.
The knowledge discovery process in databases or KDD consists of several steps, shown in Figure 4. These can be repeated to obtain the best sets of information and requires expert user intervention, emphasizing its interactive nature.
According to the KDD methodology, the first step to follow is to compile the series of experimental data considering the availability and quality of the information and adequate descriptors, depending on the type of information acquired. In this case, the interaction of time-related and climatological parameters, the energy consumption of the boat, and the electricity generation of the Santa Cruz–Baltra electricity network are proposed. In addition, the number of tourists and residents entering and leaving the Galapagos Islands by Baltra airport was calculated.
Considering the weather parameters required by the system, data-generated ambient temperature, relative humidity, global radiation, wind speed and direction, and precipitation by Meteonorm platform in the period from 1 January 2016 until 31 December 2016, one-hour intervals were included between each measurement, considered as the central point of the Itabaca channel in the Galapagos Islands. Futhermore, the existing data from the tide tables found in the digital repository of the Oceanographic Institute of the Navy [35] were analyzed, and the hourly sampling approach was made to feature all the environmental variables in the same format.
The power generation network Baltra Santa Cruz is composed of a wind system of 2.25 MW installed in Baltra, a photovoltaic system of 1.5 MWp installed in Puerto Ayora, Santa Cruz, and a power plant of 3.4 MW installed in Santa Cruz. This information is managed by the public company ELECGALÁPAGOS, through which the electricity generation information was collected in periods of one hour.
According to General Directorate of the Galapagos National Park [38], it was recorded that 170,255 people, or 78% of the total who entered the Galapagos Islands, did so through Baltra Island airport, and the same number of people also crossed the Itabaca channel. It should be considered that with respect to 2015, a decrease of 3% was registered, representing a total of 6000 tourists. This was an atypical year in the behavior of tourism on the islands due to the earthquake of 16 April 2016 on the Ecuadorian coast and the appreciation of the dollar.
Table 1 presents the input variables (attributes) and abbreviations used in the processing of the information, along with their respective units of measurement.
The creation of the database requires a special configuration in ARFF format that the WEKA software handles [39]. To generate the base file, a CSV file with comma-separated values was used, in which the data were ordered by time. The processing of the information requires the selection of an output attribute of the system called class. It represents the energy consumption of the boat by using a nominal attribute in which the low, medium-low, and medium-high ranges are considered with close reference to the energy consumption of the boat.
The approach of the output variable of a selection of attributes requires the capture of the experience of the developer. The ranges used to adjust the numerical parameters to the nominal parameters required in the output variable were as follows:
Low: 1–3.99 (kWh)
Medium low: 4–6.99 (kWh)
Medium high: 7–9.99 (kWh)
High: 10–19 (kWh)
4. Results
After reviewing in detail and considering all the possible error corrections in the information, the application of filter fills or removes, and the pre-processing, a database suitable for attribute selection research was produced. According to the characteristics of the system for analyzing the evaluator attributes (InfoGainAttributeEval), the search method (Ranker) and model selection (Full training set) were selected.
A trained and tested model is a continued examination of the attributes selected and classified according to their degree of importance concerning the system. According to the tests, features that form spatial and temporal data show the independent behavior of the training matrix.
4.1. Attribute Analysis
A classification test was performed to evaluate the quality of the pre-processed data, without discriminating any attribute. The objective was to obtain the highest value of correctly classified data with the least amount of errors. The classification algorithm used was a multilayer perceptron-type neural network with 29 hidden layers that were equivalent to the sum of the classes together with the attributes, and 5 output nodes that represented the energy consumption. In this case, these nodes were low, medium-low, medium-high, and high. The results are shown in Table 2.
Considering that in the first classification of the information pre-processed with the 25 attributes, 88.82% of the correctly classified values were obtained, the process of the selection of attributes continued to discriminate attributes that were not related to the investigation.
Attribute discrimination was performed based on 60 experiments in which various configurations and attribute selection models were used, obtaining mostly erroneous, unsolvable results or classifications in which solar radiation and energy were excluded from the selection. In this sense, and according to the established methodology and bibliographic review, the three most widely used attribute evaluators were analyzed in detail. The configuration of the first evaluator is shown in Table 3.
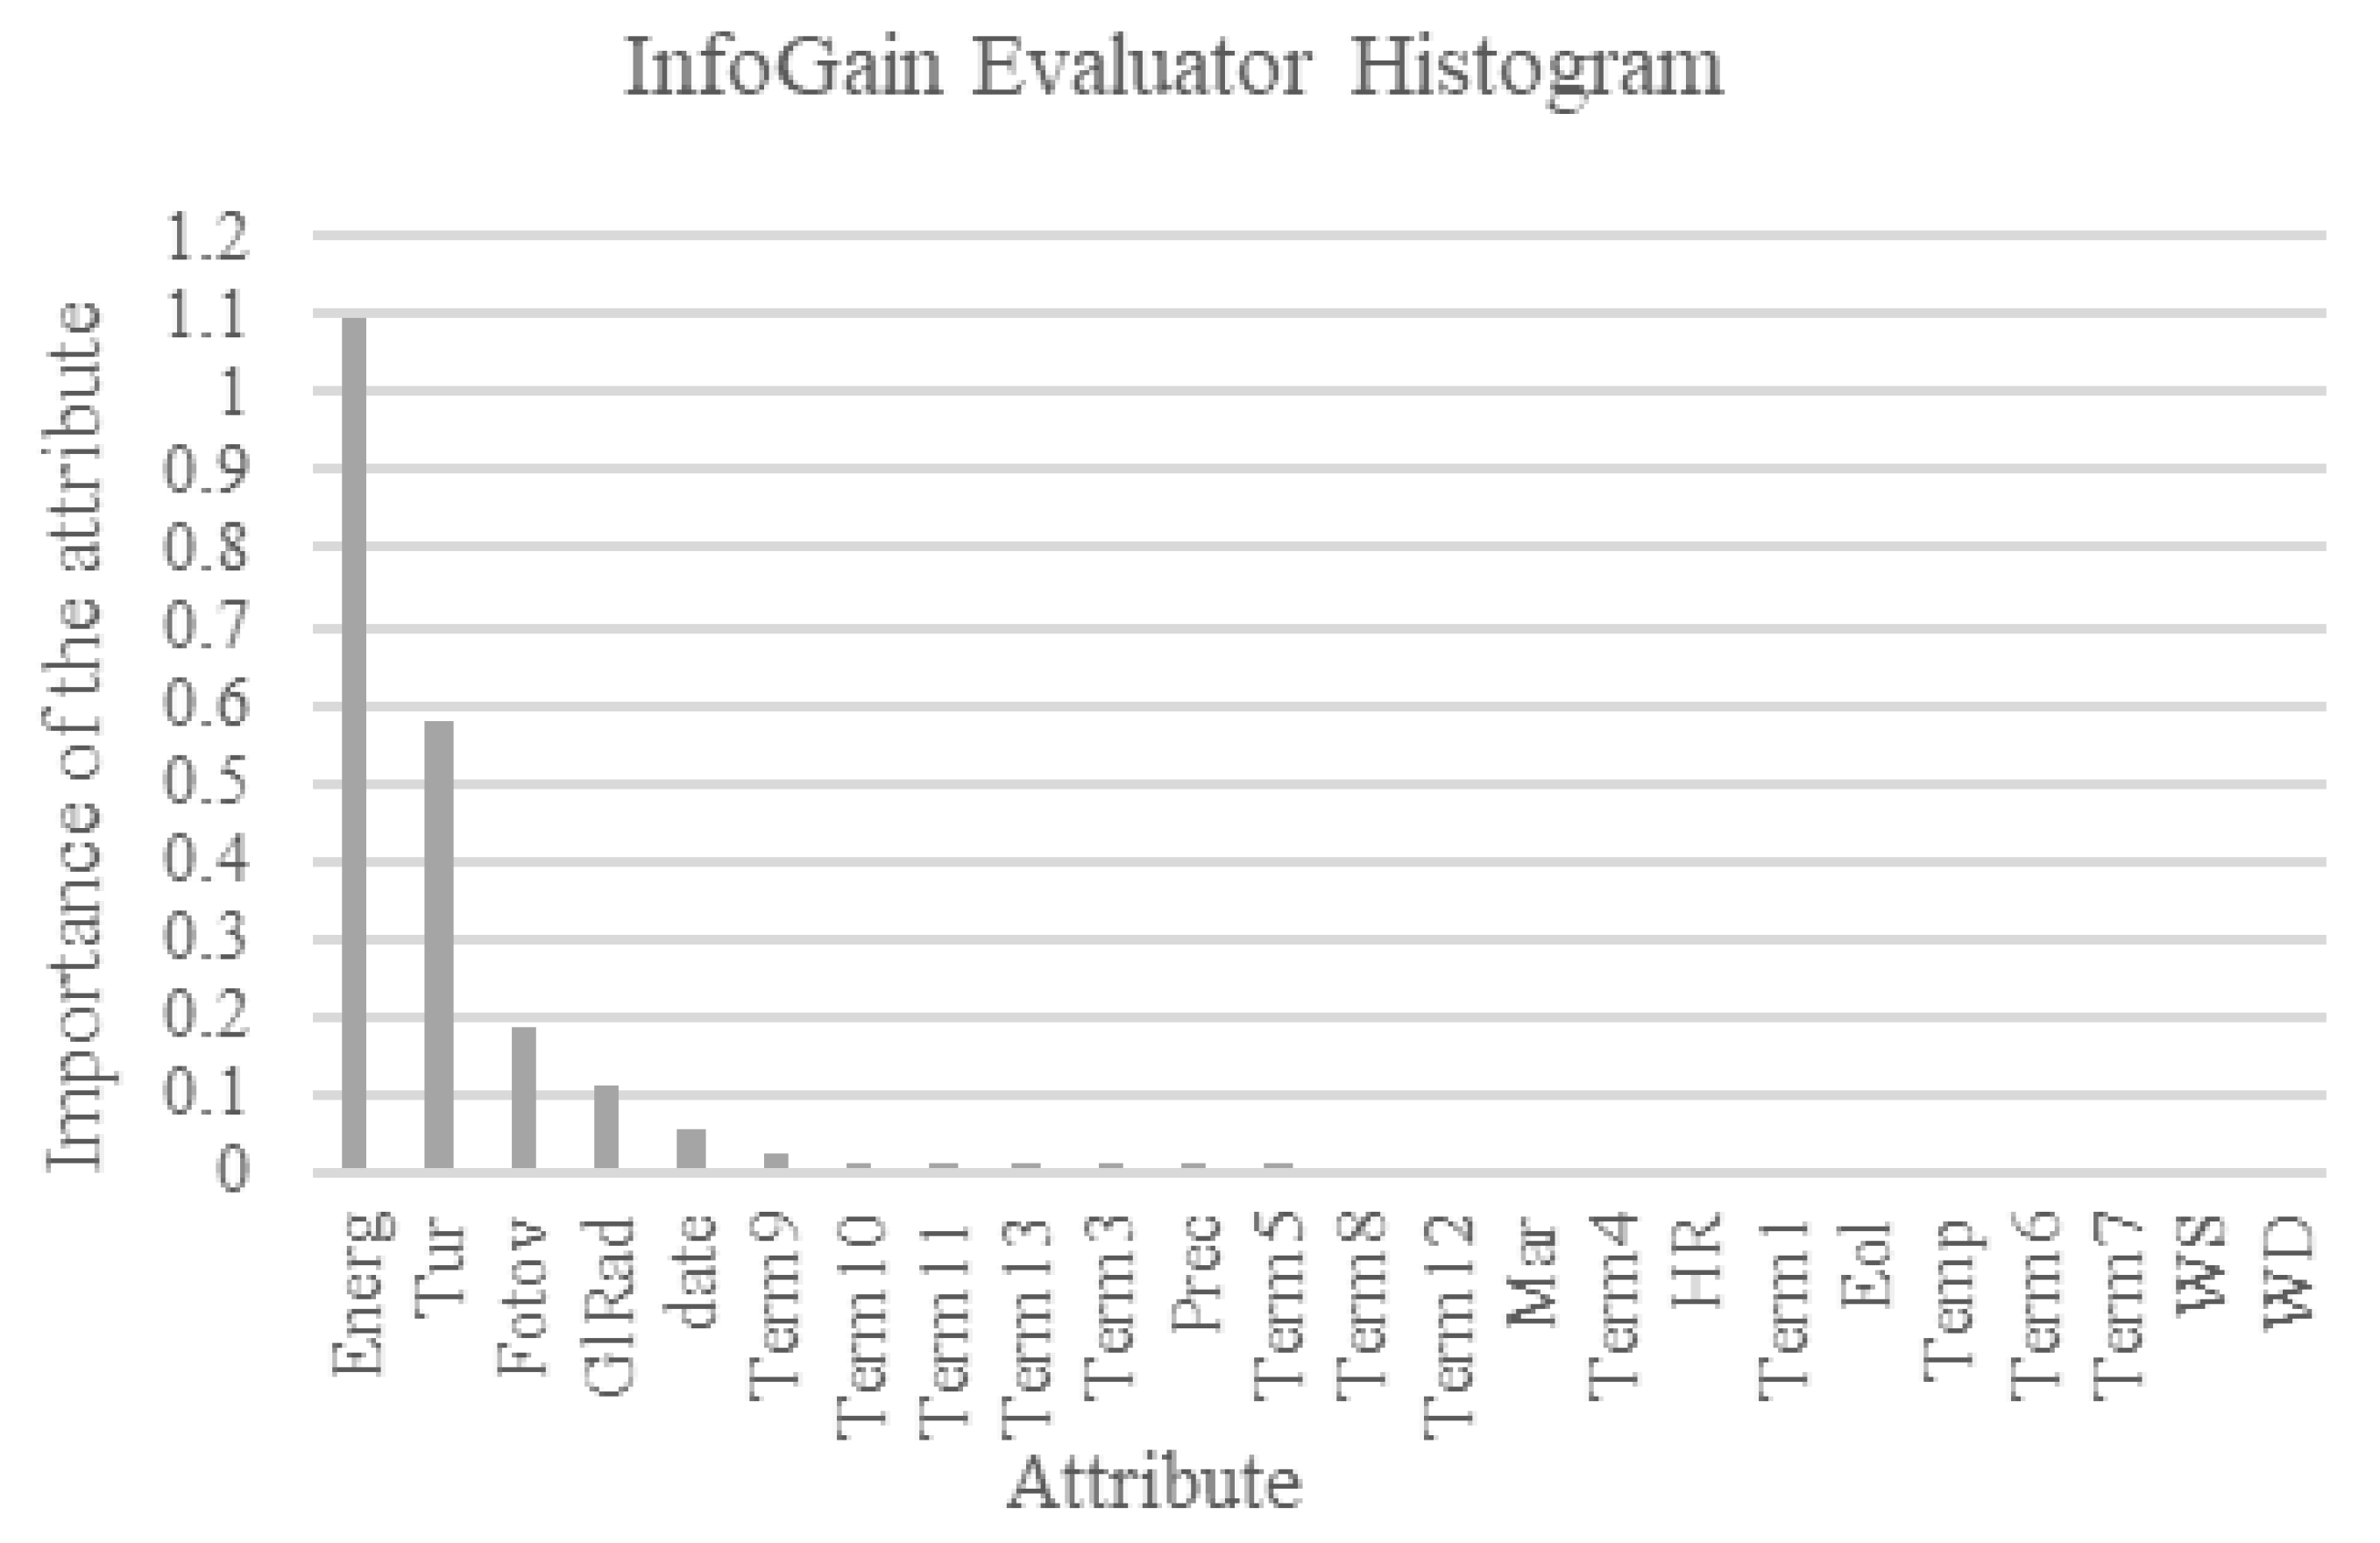
As a result of the processing of the first evaluator of attributes, the information shown in Table 4 was obtained. It shows the order of classification of each attribute and its importance weight in the data set concerning the output variable class, which represents the nominal value of energy consumption (low, medium-low, medium-high, high).
Figure 5 shows a histogram of the relationship between the importance of the attributes generated by the InfoGain method and the attributes themselves, where it is possible to select the attributes that have the greatest influence on the data set.
Table 5 presents the configuration used in the second attribute evaluation experiment.
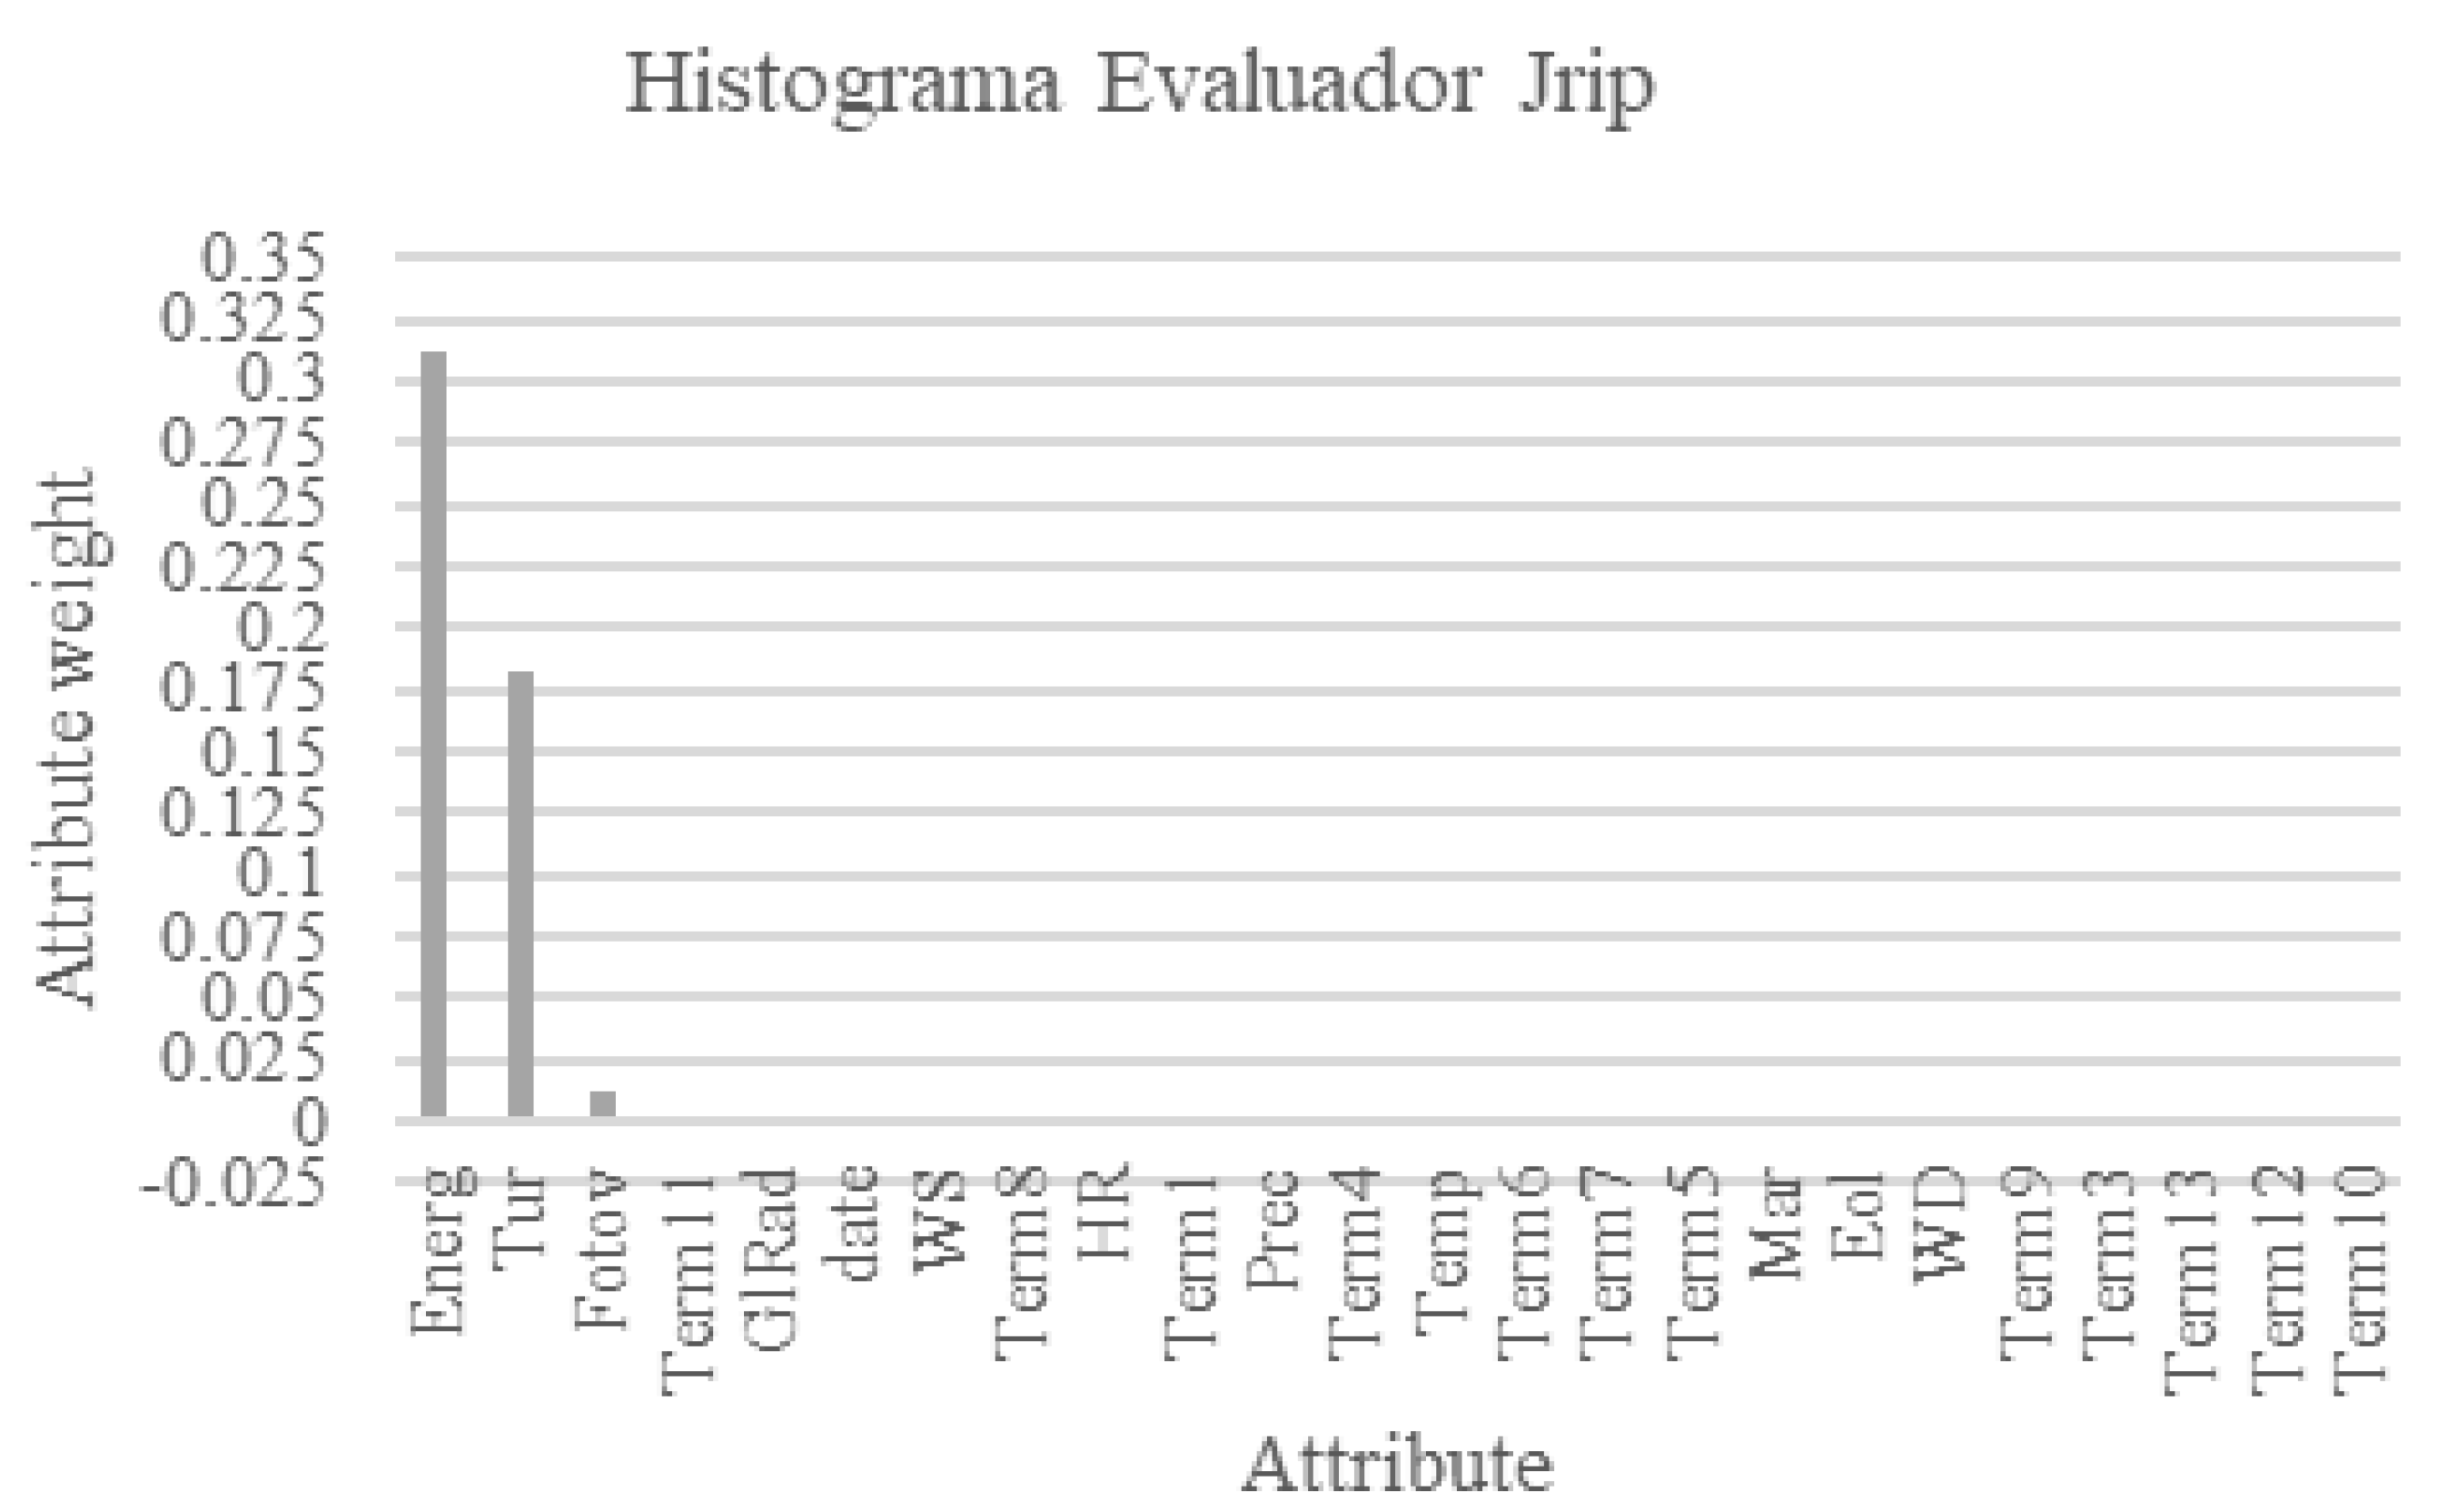
The second attribute evaluator generated the information shown in Table 6. It presents the order of classification of each attribute and the weight of its importance in the data set with respect to the output variable class, which represents the nominal value of the consumption of energy (low, medium-low, medium-high, high).
Figure 6 shows a histogram of the relationship between the importance of the attributes generated by the classifier attribute Jrip method and the attributes themselves, where the attributes that have a greater influence on the data set can be selected.
After having performed two classifications that were within the desired parameters based on the observed behavior of the boat, we continued with the last evaluator that was recommended in this type of study. As shown in Table 7 the relief evaluator allowed the evaluation of the information of the attributes while considering the influence of the attributes of the nearby sets.
As a result of the processing of the third evaluator of attributes, the information shown in Table 7 was obtained. The order of classification of each attribute and its weight of importance in the data set are presented in this table. In this particular case, the attribute data was discriminated from the classification, which, according to the experience of the observer, is not possible because all the meteorological, energy, and tourism parameters are directly dependent on the date of its creation. Therefore, the daily measurements and times cannot be excluded from the classification.
Next, we assessed the quality of the selection of attributes, for which six attributes were. A better performance was observed in the first two experiments, since the third experiment was eliminated from the study due to a lack of consistency in the selection order of the attributes.
Table 8 presents the 6 main attributes of the InfoGain evaluator that will be used in the classification experiment to seek to increase the attributes classified correctly.
To evaluate the quality of the selection of attributes, a classification test was carried out in which the objective was to obtain the highest value of correctly classified data with the least amount of errors. The classification algorithm shown in Table 9 required a multilayer perceptron-type neural network with eleveb hidden layers that were equivalent to the sum of the classes together with the attributes and five output nodes that represented the energy consumption classified in four levels: low, medium-low, medium-high, and high.
Table 10 presents the six main attributes discriminated according to the ClassifierAttributeEval Jrip evaluator. It was used in the classification experiment to increase the number of correct answers in the classification and decrease the number of errors as much as possible.
The quality analysis of the attribute selection process was performed using a classification test, as shown in Table 11. The classification algorithm used was a multilayer perceptron-type neural network with eleven hidden layers that were equivalent to the sum of the classes together with the attributes and five output nodes that represent the energy consumption classified into four levels: low, medium-low, medium-high, and high.
According to the experiments carried out and the results obtained in Table 10 using the InfoGain evaluator, the most influential attributes in the energy behavior of the “INER 1” boat are: (1) Energ (energy used by the boat), (2) Tur (tourists and residents entering or leaving the islands), (3) Fotov (Santa Cruz photovoltaic park), (4) Glrad (global radiation), (5) date (date and time), (6) Term9 (thermoelectric unit 9 of the plant Santa Cruz).
4.2. Energy Analysis
Table 12 presents a summary of the consumption and energy generation of the solar boat “INER 1” in 2016. The boat consumes most of the solar energy either to store in batteries or for services and movement, for a total of 2.32062 kWh. The boat requires 3.38916 kWh. Furthermore, the remaining energy is absorbed from the Baltra Santa Cruz electricity network for a capacity of 1.06854 kWh, of which 788.62 kWh are used for energy storage in batteries.
5. Discussion
The study carried out will allow the selection of the most influential attributes in the operation of the solar catamaran “INER 1” in the Galapagos Islands to generate both electronic and operational control strategies to increase its efficiency in the use of energy. The study will be the basis for future research on the management and prediction of solar power, which is the ship’s main source of energy.
This research is within the general field of data mining and specifically in the field of attribute selection. It applies the KDD methodology, which allows the discovery of information and its different relationships within a database. The experimental uses a series of combinations of both evaluators and classifiers based on the series of bibliographic reviews. It can achieve statistical indicators with a much higher performance than similar studies. To demonstrate this, a comparison with relevant studies is presented below.
Almaraashi [40] used different attribute selection algorithms and artificial neural networks to predict daily solar radiation at eight locations in Saudi Arabia. According to the experimental results obtained using the relief-type evaluator, the mean square error between a prediction algorithm using only the selected attributes was 19.9% compared to 52.1% of a prediction algorithm using all the system attributes. Therefore, the selection of attributes makes it possible to obtain reliable prediction results of energy consumption in a period of weather. On the other hand, Leary and Kubby [27] conclude that the use of several layers in an artificial neural network with various learning scenarios together with a selection of the four main attributes and a pre-processing of the information manages to obtain an accuracy of classification as a prediction of 92.2%.
Salcedo-Sanz and Cornejo-Bueno [17] present the use of attribute selection and pre-processing of information as the first step in energy prediction, which increases the performance of a classification algorithm and recommends using various combinations of techniques that do not require a high computational load, generating adequate results for the system being analyzed for solar, wind, or tidal energy.
Regarding the research carried out and considering the six best attributes filtered by the InfoGain evaluating algorithm, 4.95% was obtained in the mean square error parameter using a backpropagation-type multilayer perceptron classification. Additionally, the prediction algorithm with 11 hidden layers found a 98.94% accuracy in classification and prediction. The combination of techniques developed made it possible to obtain better results than the investigations mentioned above, generating a basis for developing studies on the prediction of the vessel’s energy consumption and operational control for the additional energy of the electrical network that the boat requires to meet its annual demand, not relying on fossil-fuel sources.
The consumption and generation of electrical energy in the system show that the vessel requires 1.06854 kWh of additional energy per year, which comes from the Baltra Santa Cruz electrical network. Currently, the boat obtains part of this energy from thermoelectric unit 9 and the photovoltaic park of the Santa Cruz plant. The exact percentage of electrical energy from thermoelectric unit 9 can be obtained from studying electrical charges and flows. This mixture of energy sources reduces the overall energy efficiency of the vessel by using fossil energy as the basis.
6. Conclusions
The additional energy required by the “INER 1” vessel is about 1.06854 kWh, which comes from the Santa Cruz photovoltaic park and thermoelectric unit 9 of the Santa Cruz power generation plant. If we consider that the attribute of solar radiation is the fourth most influential on the system, and if the solar radiation decreases both in the boat and in the photovoltaic park, the energy consumption required will come mostly from the Santa Cruz thermoelectric power plant.
The attribute energy represents the electrical consumption of the boat that comes from its photovoltaic generation and the electrical network, both for energy storage and for the consumption of electrical systems of force and control. The variable shows the behavior of the boat, since it maintains a direct relationship with the date attribute, which represents the date and time, and the Tur attribute, which symbolizes the number of tourists that the boat transports.
As the number of tourists and navigation frequencies increases, the energy consumption of the boat also increases. It is necessary to generate operational control strategies that allow the ship to use the electrical network where the Baltra Island wind farm is located by delivering electrical energy to the grid since, currently, the attribute wind and wind generation do not have any relation to the load cycles or their hours of use.
The increase or decrease in the tide does not influence the energy consumption of the boat because the variation in height occurs in centimeters per hour. Therefore, it is observed that the attribute sea is not related to energy. It should be noted that the study did not consider the speed and direction with which the sea current moves due to the lack of such information.
The global radiation attribute Glrad is directly related to the energetic behavior of the vessel, considering that the basis of its energy generation is the 4.20 kWp photovoltaic system, which it carries on its upper deck next to the Santa Cruz photovoltaic generation plant, and that the thermoelectric plants deliver the electrical energy with which the “INER 1” solar boat recharges.
The attributes temperature and environmental humidity do not have any relation to the energetic behavior of the boat. Their variation does not affect the energy consumption of the system. The ship has passive ventilation systems to dissipate the heat generated in the engines and batteries.
The remaining attributes that were not considered in the study do not have any relationship with the energy consumption of the boat. In this sense, it is possible to obtain a set of data that will serve as the basis for implementing a prediction model of energy consumption considering the annual increase in the number of tourists and the solar radiation in the area of operation of the boat.
Author Contributions
Conceptualization, M.M.; methodology, J.M.-G.; investigation, J.M.-G.; writing—original draft preparation, E.U.; writing—review and editing M.C.-D.; visualization, M.M.; supervision, J.M.-G. All authors have read and agreed to the published version of the manuscript.
Funding
This research was supported by the Instituto de Investigación Geológico y Energético (IIGE) grant funded by the Ecuadorian government.
Institutional Review Board Statement
The study was conducted in accordance with the Declaration of Helsinki, and approved by the Institutional Review Board (or Ethics Committee) of Instituto de Investigación Geológico y Energético.
Data Availability Statement
Not applicable.
Acknowledgments
This research is part of the arduous and continuous work of the staff of the Institute of Geological and Energy Research. The valuable contribution of information from the public company, CELEC EP, in charge of electricity generation and the Galapagos National Park, which monitors the number of tourists and residents entering the islands, is also appreciated.
Conflicts of Interest
The authors declare no conflict of interest.
References
- Cuvi, N.; Guijarro, D. ¿ Una trayectoria hacia la insustentabilidad? La movilidad terrestre en la isla Santa Cruz, Galápagos. Rev. Transp. Y Territ. 2016, 15, 216–240. [Google Scholar] [CrossRef]
- Helling, R.K. The Role of LCA in Sustainable Development. In Encyclopedia of Sustainable Technologies; Abraham, M.A., Ed.; Elsevier: Oxford, UK, 2017; pp. 237–242. [Google Scholar] [CrossRef]
- Rivela, B.; Montero, A.; Criollo, B.; Vaca, D.; López-Villada, J. Environmental Policies in Maritime Transport: A Case Study of Solar Ship in Galapagos Islands. In Proceedings of the EuroSun 2014, ISES Conference, Aix-les-Bains, France, 16–19 September 2014. [Google Scholar]
- Ko, N.; Gantner, J. Local added value and environmental impacts of ship scrapping in the context of a ship’s life cycle. Ocean Eng. 2016, 122, 317–321. [Google Scholar] [CrossRef]
- Gursu, H. Solar And Wind Powered Concept Boats: The Example Of Volitan. METU J. Fac. Archit. 2016, 31, 109–123. [Google Scholar] [CrossRef]
- Bleicher, A. Solar sailor [Dream Jobs 2013—Renewables]. IEEE Spectr. 2013, 50, 45–46. [Google Scholar] [CrossRef]
- Lucas, A.; Neto, R.C.; Silva, C.A. Energy supply infrastructure LCA model for electric and hydrogen transportation systems. Energy 2013, 56, 70–80. [Google Scholar] [CrossRef]
- Ling-Chin, J.; Heidrich, O.; Roskilly, A.P. Life cycle assessment (LCA)—From analysing methodology development to introducing an LCA framework for marine photovoltaic (PV) systems. Renew. Sustain. Energy Rev. 2016, 59, 352–378. [Google Scholar] [CrossRef] [Green Version]
- Schiller, L.; Alava, J.J.; Grove, J.; Reck, G.; Pauly, D. The demise of Darwin’s fishes: Evidence of fishing down and illegal shark finning in the Galápagos Islands. Aquat. Conserv. Mar. Freshw. Ecosyst. 2015, 25, 431–446. [Google Scholar] [CrossRef]
- Maggí, P.D.E.; Rodríguez, J.P.C.; Litardo, J.E.T.; Caviedes, E.C.E. Análisis del mercado turístico de las islas galápagos: Caso cruising galápagos. Obs. De La Econ. Latinoam. 2018. Available online: http://www.eumed.net/2/rev/oel/2018/02/mercado-turistico-galapagos.html. (accessed on 1 December 2021).
- Parque-Nacional-Galápagos. Informe Anual 2017 Visitantes a Las Áreas Protegidas de Galápagos; Ministerio del Ambiente: Puerto Ayora, Galápagos, Ecuador, 2017. Available online: http://www.galapagos.gob.ec/ (accessed on 1 December 2021).
- García, J.; Rangel, E.; Farías, M. Informe Galápagos 2011–2012, DPNG, GCREG, FCD y GC; Administración del Parque Nacional Galápagos: Puerto Ayora, Ecuador, 2013. [Google Scholar]
- Jara-Alvear, J.; Pastor, H.; Garcia, J.; Casafont, M.; Araujo, E.; Calderon, E. Embarcaciones solares, una evolución al transporte marino en las islas Galápagos, Ecuador. In Proceedings of the 1st International congress and scientific expo ISEREE, Quito, Ecuador, November 2013; pp. 1–8. [Google Scholar]
- Moya, M.; Arroyo, D. Análisis de los resultados de la operación del catamarán “Génesis Solar” en el estrecho de Itabaca (Islas Galápagos). Congr. Int. 2015, 2, 68–72. Available online: https://docplayer.es/44822739-I-d-i-en-sostenibilidad-energetica-iner-2015.html (accessed on 1 December 2021).
- INAMHI. Instituto Nacional de Meteorología e Hidrología; INAMHI: Quito, Ecuador, 17 July 2014. [Google Scholar]
- Touati, F.; Chowdhury, N.A.; Benhmed, K.; San Pedro Gonzales, A.J.R.; Al-Hitmi, M.A.; Benammar, M.; Gastli, A.; Ben-Brahim, L. Long-term performance analysis and power prediction of PV technology in the State of Qatar. Renew. Energy 2017, 113, 952–965. [Google Scholar] [CrossRef]
- Salcedo-Sanz, S.; Cornejo-Bueno, L. Feature selection in machine learning prediction systems for renewable energy applications. Renew. Sustain. Energy Rev. 2018, 90, 728–741. [Google Scholar] [CrossRef]
- Hatwaambo, S.; Jain, P.C.; Perers, B.; Karlsson, B. Projected beam irradiation at low latitudes using Meteonorm database. Renew. Energy 2009, 34, 1394–1398. [Google Scholar] [CrossRef]
- Zhang, W.; Dang, H.; Simoes, R. A new solar power output prediction based on hybrid forecast engine and decomposition model. ISA Trans. 2018, 81, 105–120. [Google Scholar] [CrossRef] [PubMed]
- Meteonorm. Publication Page. Available online: www.meteonorm.com (accessed on 1 December 2021).
- Okello, D.; Van Dyk, E.E.; Vorster, F.J. Analysis of measured and simulated performance data of a 3.2kWp grid-connected PV system in Port Elizabeth, South Africa. Energy Convers. Manag. 2015, 100, 10–15. [Google Scholar] [CrossRef]
- Witten, I.H.; Frank, E.; Hall, M.A.; Pal, C.J. Data Mining: Practical Machine Learning Tools and Techniques; Morgan Kaufmann: Burlington, MA, USA, 2016. [Google Scholar]
- Tan, P.N.; Steinbach, M.; Karpatne, A.; Kumar, V. Introduction to Data Mining; Pearson Education: London, UK, 2018; ISBN 9780133128901. [Google Scholar]
- Rodríguez, Y.; Fernández, Y.; Bello, R.; Caballero, Y. Selección de atributos relevantes aplicando algoritmos que combinan conjuntos aproximados y optimización en colonias de hormigas. Rev. Cuba. De Cienc. Inf. 2014, 8, 79–86. [Google Scholar]
- Chandrashekar, G.; Sahin, F. A survey on feature selection methods. Comput. Electr. Eng. 2014, 40, 16–28. [Google Scholar] [CrossRef]
- Martínez, J.J. Análisis de minería de datos distribuida con Weka Parallel en computadoras con múltiples procesadores físicos y lógicos. Econ. Y Adm. 2017, 6, 155–166. [Google Scholar] [CrossRef] [Green Version]
- Leary, D.; Kubby, J. Feature Selection and ANN Solar Power Prediction. J. Renew. Energy 2017, 2017, 7. [Google Scholar] [CrossRef] [Green Version]
- Saad, S.; Ishtiyaque, M.; Malik, H. Selection of most relevant input parameters using WEKA for artificial neural network based concrete compressive strength prediction model. In Proceedings of the 2016 IEEE 7th Power India International Conference (PIICON), Bikaner, India, 25–27 November 2016; pp. 1–6. [Google Scholar]
- Gutiérrez, J.A.G. Comenzando con Weka: Filtrado y Selección de Subconjuntos de Atributos Basada en su Relevancia Descriptiva Para la Clas; ETSI Informática, Universidad Nacional de Educación a Distancia: Madrid, Spain, 2016. [Google Scholar]
- Navarro, J.J.L. Selección de Atributos en Aprendizaje Automático Basada en Teoría de la Información. Doctoral Dissertation, Universidad de Las Palmas de Gran Canaria, Las Palmas, Spain, 2001. Available online: https://www.siani.es/files/documentos/tesisdoctorales/Tesis_J_J_Lorenzo_Navarro.pdf (accessed on 1 December 2021).
- Khmaissia, F.; Frigui, H.; Sunkara, M.; Jasinski, J.; Garcia, A.M.; Pace, T.; Menon, M. Accelerating band gap prediction for solar materials using feature selection and regression techniques. Comput. Mater. Sci. 2018, 147, 304–315. [Google Scholar] [CrossRef]
- INER. Informe del Sistema Fotovoltaico del Catamarán Solar de las Islas Galápagos; INER: Quito, Ecuador, 2014.
- Jurado, S.; Nebot, À.; Mugica, F.; Avellana, N. Hybrid methodologies for electricity load forecasting: Entropy-based feature selection with machine learning and soft computing techniques. Energy 2015, 86, 276–291. [Google Scholar] [CrossRef] [Green Version]
- Kumar, N.M.; Kumar, M.R.; Rejoice, P.R.; Mathew, M. Performance analysis of 100 kWp grid connected Si-poly photovoltaic system using PVsyst simulation tool. Energy Procedia 2017, 117, 180–189. [Google Scholar] [CrossRef]
- INOCAR, I.O.d.l.A. Tabla de Mareas INOCAR, Galapagos, Ecuador. 2016. Available online: https://www.inocar.mil.ec/web/index.php/productos/tabla-mareas (accessed on 1 December 2021).
- Del Álamo, L.M. Relaciones Entre Mareas y Otros Fenómenos Geodinámicos: Estudios en la Península Ibérica y California; Universidad Complutense de Madrid: Madrid, Spain, 2016. [Google Scholar]
- Saeteros, A.M.; Da Silva, E.V.; Calles, V.G. Análisis de la Demanda del Turismo para la Gestión Sustentable del Destino en las Islas Galápagos-Ecuador. An. Bras. De Estud. Turísticos-ABET 2017, 7, 78–88. [Google Scholar] [CrossRef] [Green Version]
- DPNG, Dirección del Parque Nacional Galápagos. Informe Anual de Visitantes a las áreas Protegidas; 2016; Available online: https://www.galapagos.gob.ec/wp-content/uploads/downloads/2017/07/Informe_visitantes_Anual_2016_vfinal.pdf (accessed on 1 December 2021).
- Frank, E.; Hall, M.; Holmes, G.; Kirkby, R.; Pfahringer, B.; Witten, I.H.; Trigg, L. Weka-a machine learning workbench for data mining. In Data Mining and Knowledge Discovery Handbook; Springer: Berlin/Heidelberg, Germany, 2009; pp. 1269–1277. [Google Scholar]
- Almaraashi, M. Investigating the impact of feature selection on the prediction of solar radiation in different locations in Saudi Arabia. Appl. Soft Comput. 2018, 66, 250–263. [Google Scholar] [CrossRef]
Figure 1.
Solar Catamaran “INER 1”.

Figure 2.
Single-layer perceptron.

Figure 3.
Multilayer perceptron.

Figure 4.
Knowledge discovery in databases (KDD).

Figure 5.
Importance of InfoGain attribute vs. attributes.

Figure 6.
Importance of Jrip attribute vs. attributes.


Table 1.
Study variable information.
| Input Variable | Abbreviation | Units |
|---|---|---|
| Date and Time | date | aaaa-dd-mm hh:mm:ss |
| Energy used by the boat (Baltra—Santa Cruz electrical network, photovoltaic generation of the vessel, battery bank) | Energ | kWh |
| Temperature | Temp | °C |
| Relative humidity | HR | % |
| Global radiation | GlRad | kWm2/h |
| Wind direction | WD | ° from the north |
| Wind speed | WS | m/s |
| Precipitation | Prec | mm |
| Caterpilar Unit 1 | Term1 | kWh |
| Caterpilar Unit 3 | Term3 | kWh |
| Caterpilar Unit 4 | Term4 | kWh |
| Caterpilar Unit 5 | Term5 | kWh |
| Caterpilar Unit 6 | Term6 | kWh |
| Caterpilar Unit 7 | Term7 | kWh |
| Hyundai Unit 8 | Term8 | kWh |
| Hyundai Unit 9 | Term9 | kWh |
| Hyundai Unit 10 | Term10 | kWh |
| Hyundai Unit 11 | Term11 | kWh |
| Hyundai Unit 12 | Term12 | kWh |
| Hyundai Unit 13 | Term13 | kWh |
| Baltra wind farm | Eol | kWh |
| Santa Cruz photovoltaic plant | Fotov | kWh |
| Sea height | Mar | m |
| Tourists | Tur | people |
Table 2.
Classification of the 25 pre-processed attributes.
| Input Variable | Abbreviation | ||
|---|---|---|---|
| MultiLayer perceptron 29 hidden layers Backpropagation network type 5 output nodes | Instances correctly classified | 922 | 88.82% |
| Misclassified instances | 116 | 11.17% | |
| Kappa statistic | 0.67 | ||
| Mean absolute error | 0.04 | ||
| Root-mean-square-error | 0.21 | ||
| Relative absolute error | 26.45% | ||
| Relative Ssquare error | 74.22% | ||
| Total number of instances | 1038 | ||
Table 3.
Configuration of the first attribute evaluator.
| Attribute Evaluator | Attribute Selection Mode | Search Method | Study Variable |
|---|---|---|---|
| InfoGainAttributeEval | Full training set | Ranker | Class |
Table 4.
InfoGain evaluator attribute classification.
| Classifier Order | Attribute | InfoGain Merit |
|---|---|---|
| 1 | Energ | 1.09798 |
| 2 | Tur | 0.57595 |
| 3 | Fotov | 0.18327 |
| 4 | GlRad | 0.10919 |
| 5 | date | 0.05443 |
| 6 | Term9 | 0.02289 |
| 7 | Term10 | 0.01495 |
| 8 | Term11 | 0.01279 |
| 9 | Term13 | 0.01208 |
| 10 | Term3 | 0.01025 |
| 11 | Prec | 0.00955 |
| 12 | Term5 | 0.00942 |
| 13 | Term8 | 0.00848 |
| 14 | Term12 | 0.0069 |
| 15 | Mar | 0.00671 |
| 16 | Term4 | 0.00627 |
| 17 | HR | 0.00622 |
| 18 | Term1 | 0 |
| 19 | Eol | 0 |
| 20 | Temp | 0 |
| 21 | Term6 | 0 |
| 22 | Term7 | 0 |
| 23 | WS | 0 |
| 23 | WD | 0 |
Table 5.
Configuration of the second attribute evaluator.
| Attribute Evaluator | Attribute Selection Mode | Search Method | Study Variable |
|---|---|---|---|
| ClassifierAttibuteEval Jrip | Full training set | Ranker | Class |
Table 6.
Attribute classification evaluator classifier attribute Jrip.
| Classifier Order | Attribute | Jrip Merit |
|---|---|---|
| 1 | Energ | 0.3113551 |
| 2 | Tur | 0.182028316 |
| 3 | Fotov | 0.013002023 |
| 4 | Term11 | 0.001059424 |
| 5 | GlRad | 0.000866802 |
| 6 | date | 0.000144467 |
| 7 | WS | 0 |
| 8 | Term8 | 0 |
| 9 | HR | 0 |
| 10 | Term1 | −1 × 10⁻¹⁶ |
| 11 | Prec | −0.000144467 |
| 12 | Term4 | −0.000144467 |
| 13 | Temp | −0.000433401 |
| 14 | Term6 | −0.000433401 |
| 15 | Term7 | −0.000433401 |
| 16 | Term5 | −0.000577868 |
| 17 | Mar | −0.000722335 |
| 18 | Eol | −0.000722335 |
| 19 | WD | −0.000722335 |
| 20 | Term9 | −0.001300202 |
| 21 | Term3 | −0.001444669 |
| 22 | Term13 | −0.001589136 |
| 23 | Term12 | −0.001733603 |
| 23 | Term10 | −0.002455938 |
Table 7.
Attribute classification evaluator classifier attribute Jrip.
| Classifier Order | Attribute | Jrip Merit |
|---|---|---|
| 1 | Tur | 0.135493 |
| 2 | Energ | 0.110779 |
| 3 | Fotov | 0.055994 |
| 4 | GlRad | 0.034984 |
| 5 | Term3 | 0.028548 |
| 6 | Eol | 0.02564 |
| 7 | Term9 | 0.024717 |
| 8 | Mar | 0.023221 |
| 9 | HR | 0.023154 |
| 10 | Term8 | 0.019967 |
| 11 | Term10 | 0.019596 |
| 12 | Term11 | 0.018686 |
| 13 | Temp | 0.017447 |
| 14 | Term4 | 0.017266 |
| 15 | WS | 0.016182 |
| 16 | Term5 | 0.015636 |
| 17 | Term12 | 0.014259 |
| 18 | Term6 | 0.013598 |
| 19 | Prec | 0.012945 |
| 20 | Term13 | 0.011907 |
| 21 | WD | 0.009496 |
| 22 | Term1 | 0.006279 |
| 23 | Term7 | 0.000108 |
| 24 | date | 0 |
Table 8.
Main attributes InfoGain evaluator.
| Classifier Order | Attribute | InfoGain Merit |
|---|---|---|
| 1 | Energ | 1.09798 |
| 2 | Tur | 0.57595 |
| 3 | Fotov | 0.18327 |
| 4 | GlRad | 0.10919 |
| 5 | date | 0.05443 |
| 6 | Term9 | 0.02289 |
Table 9.
Classification of the six attributes with the Infogain evaluator.
| Classifier | Classifier Results | ||
|---|---|---|---|
| MultiLayer Perceptron 11 hidden layers Backpropagation 5 output nodes | Instances correctly classified | 1027 | 98.94% |
| Misclassified instances | 11 | 1.06% | |
| Kappa statistic | 0.97 | ||
| Mean absolute error | 0.005 | ||
| Square root error | 0.049 | ||
| Relative absolute error | 3.26% | ||
| Relative square error | 17.63% | ||
| Total number of instances | 1038 | ||
Table 10.
Main attributes evaluator classifier attribute Jrip.
| Classifier Order | Attribute | InfoGain Merit |
|---|---|---|
| 1 | Energ | 0.3113551 |
| 2 | Tur | 0.182028316 |
| 3 | Fotov | 0.013002023 |
| 4 | Term11 | 0.001059424 |
| 5 | GlRad | 0.000866802 |
| 6 | Term9 | 0.02289 |
Table 11.
Classification of the six attributes with the evaluator classifier attribute Jrip.
| Classifier | Classifier Results | ||
|---|---|---|---|
| MultiLayer perceptron 11 hidden layers backpropagation 5 output nodes | Instances correctly classified | 1000 | 96.34% |
| Misclassified instances | 38 | 6.66% | |
| Kappa statistic | 0.97 | ||
| Mean absolute error | 0.005 | ||
| Square root error | 0.05 | ||
| Relative absolute error | 3.26% | ||
| Relative Square Error | 17.64% | ||
| Total number of instances | 1038 | ||
Table 12.
Generation and electric consumption of the solar vessel “INER 1”.
| Battery-Powered Electric Network kWh | Electricity Network to Consumer kWh | Solar Powered by Batteries kWh | Solar Energy to Electrical Network kWh | Solar Energy to Consumers kWh | Total Energy kWh |
|---|---|---|---|---|---|
| 788.62 | 279.92 | 1.45164 | 0 | 868.98 | 3.38916 |
Publisher’s Note: MDPI stays neutral with regard to jurisdictional claims in published maps and institutional affiliations. |
© 2022 by the authors. Licensee MDPI, Basel, Switzerland. This article is an open access article distributed under the terms and conditions of the Creative Commons Attribution (CC BY) license (https://creativecommons.org/licenses/by/4.0/).
Share and Cite
MDPI and ACS Style
Moya, M.; Martínez-Gómez, J.; Urresta, E.; Cordovez-Dammer, M. Feature Selection in Energy Consumption of Solar Catamaran INER 1 on Galapagos Island. Energies 2022, 15, 2761. https://doi.org/10.3390/en15082761
AMA Style
Moya M, Martínez-Gómez J, Urresta E, Cordovez-Dammer M. Feature Selection in Energy Consumption of Solar Catamaran INER 1 on Galapagos Island. Energies. 2022; 15(8):2761. https://doi.org/10.3390/en15082761
Chicago/Turabian StyleMoya, Marcelo, Javier Martínez-Gómez, Esteban Urresta, and Martín Cordovez-Dammer. 2022. "Feature Selection in Energy Consumption of Solar Catamaran INER 1 on Galapagos Island" Energies 15, no. 8: 2761. https://doi.org/10.3390/en15082761
Note that from the first issue of 2016, this journal uses article numbers instead of page numbers. See further details here.