Article

Energy Transition Scenarios for Fossil Fuel Rich Developing Countries under Constraints on Oil Availability: The Case of Ecuador

by
Vicente Sebastian Espinoza
1,2,*,
Javier Fontalvo
1,
Paola Ramírez
1,
Jaime Martí-Herrero
3,4 and
Margarita Mediavilla
2
1
Instituto de Investigacion Geologico y Energetico (IIGE), Quito 170518, Ecuador
2
Research Group on Energy, Economy and System Dynamics, Escuela de Ingenierías Industriales, Paseo del Cauce s/n, University of Valladolid, 47011 Valladolid, Spain
3
Biomass to Resources Group, Universidad Regional Amazonica Ikiam, Via Tena-Muyuna, Km.7, Tena 150102, Ecuador
4
Building Energy and Environment Group, Centre Internacional de Mètodes Numérics en Enginyeria (CIMNE), 08034 Terrassa, Barcelona, Spain
*
Author to whom correspondence should be addressed.
Energies 2022, 15(19), 6938; https://doi.org/10.3390/en15196938
Submission received: 23 August 2022 / Revised: 13 September 2022 / Accepted: 15 September 2022 / Published: 22 September 2022
(This article belongs to the Collection Energy Economics and Policy in Developed Countries)

Abstract

:
The aim of this paper is to analyze energy pathways for a fossil fuel rich developing country towards an energy transition considering national and international oil availability using Ecuador as a reference. An integrated assessment model has been developed to simulate energy transition scenarios considering constraints on oil availability at the national and global level. Results show that if current trends in energy demand and supply persist, energy scarcity would start around 2040 due to depletion of national oil reserves and restricted access to foreign oil. This would trigger a degrowth in economic activity in sectors with high dependency on petroleum products. Scenarios with conservative efforts might partially revert the increasing use of fossil fuels supported by policies for energy efficiency and substitution of liquid fuels with electricity mainly from renewables. However, energy shortages would still be foreseeable as well as a decay of the economy. Under a maximum efforts scenario with an optimistic availability of national oil, a moderate-sustained economic growth could be feasible. This shows that oil would still play a key role during the transition. Furthermore, ambitious policies must be implemented in the short term to smooth the effects of displacing oil as energy and income source.

1. Introduction

The increasing concern regarding climate change effects, along with the depletion of non-renewable energy sources has triggered a process to change the existing model of the global energy system to a new paradigm to achieve significant reductions in carbon emissions [1]. Efforts have been made through the establishment of agreements, the most important being the Paris Agreement. This accord fosters the parties to work on strategies to limit temperature increase to “well below 2 °C above pre-industrial levels”. It also indicates that the peak of carbon emissions must come in the shortest possible time [2]. Considering that two thirds of global greenhouse gas emissions are attributed to fossil fuels supply and demand [3], efforts must be focused on a transition towards more renewable, and sustainable systems.
This could be a complicated endeavor for developing countries given their rising energy demand tied up to economic growth. Energy demand has increased with transport as the main sector, which is mainly based on inefficient technologies (internal combustion engines) that use imported and subsidized fossil fuels in some cases [4,5,6]. For fossil fuel rich developing countries, relying on the revenues of oil and gas production increases their vulnerability towards a shift in the energy landscape. An increasing domestic demand along with a future reduction of fossil fuels in the world energy mix could compromise the export capability of these nations and the imports of fossil fuels [7,8]. However, some of these nations would have a key role in the change of the energy landscape given their vast remaining renewable potential and their rising electricity demand. In fact, many of them have included the deployment of renewables as part of their national plans to meet their increasing electricity needs [9,10,11,12,13,14,15,16,17]. Moreover, given the energy consumption levels, the size of the economies, and the features of the energy systems, these nations are suitable for more rapid and feasible transformations [6].
Energy transition plans to be successful must include policies aligned to energy system features and these narratives must enclose energy supply, and energy demand. Despite the urgency of reducing GHG emissions, it is expected that the transition process would require time, favorable economics, technological change, and access to resources [3,18]. However, energy transition must be quick enough to avoid increasing environmental problems, potential shortages, and economic decay [19].
Analyzing the possible pathways towards a transition includes assessing the dynamics between energy, technology, economy-society, and environment. To capture the interaction of these subsystems, the use of Integrated Assessment Models (IAM) provides a solid framework [20] that has been used at both national and global scale [21,22,23,24,25,26,27,28,29,30].
Regarding fossil fuel rich developing countries, particularly Ecuador, several studies have been developed using IAMs. Most of them have focused on visualizing long-term pathways of the energy system in general [28,31,32], the transport sector [31,32,33,34], the development of renewables for electricity generation [29,31,35,36], implementation of energy efficiency [32,34,37], and implementation of National Determined Contributions (NDC) [30]. Only one study has explored deep decarbonization scenarios aligned to the Paris Agreement and the link between energy and land use [38].
Even though some of these studies have included biophysical limits at the national level, specifically oil reserves [31,32,38], global restrictions regarding fossil fuels supply (natural gas, oil, and oil products) have not been considered. Moreover, energy demand has been exogenously modeled, and there are no interactions between resources’ possible scarcity in the future, continuous economic growth, and energy use. A clear example is that all IAMs developed for Ecuador so far have assumed that the country might have access to all energy imports necessary for maintaining the expected growth of economic activity. However, this assumption is questionable given that developed countries with much larger economies would have priority in case of shortages in world energy supply.
Ecuadorian Energy Development under Energy Constraints (EEDEC) is a new simulation model based on a system dynamics approach that evaluates the effects of oil and oil products’ scarcity in the energy system considering both supply and demand. Energy supply will depend on national and global energy availability and energy infrastructures. If there is energy scarcity, pressure to improve energy intensity and source replacement for more abundant sources will occur based on established limits. Once these limits have been reached, economic activity will be adjusted based on energy availability (Supplementary Material offers a vast description of the model).
Considering the approach and methodological frameworks used in the previous studies, it is of interest to analyze the implications that economic growth, and both local and global biophysical constraints might have in Ecuador’s energy system towards a transition process given its status of fossil fuel rich developing country [39], and its renewables potential [40,41].
The objective of this paper is to evaluate medium term energy transition scenarios for Ecuador under expected economic growth and to what extent this economic development is feasible based on local and global resource availability, current national energy plans, and ambitious decarbonization goals. For this aim, the EEDEC simulation model has been used. This tool has the potential to assess policies and strategies focused on reducing fossil fuels share in the energy mix and inform decision makers of potential energy scarcity that might compromise economic growth.
Following the introduction, Section 2 describes the methodology used for this research. Section 3 presents the results followed by the discussion in Section 4. Section 5 gives conclusions and future work.

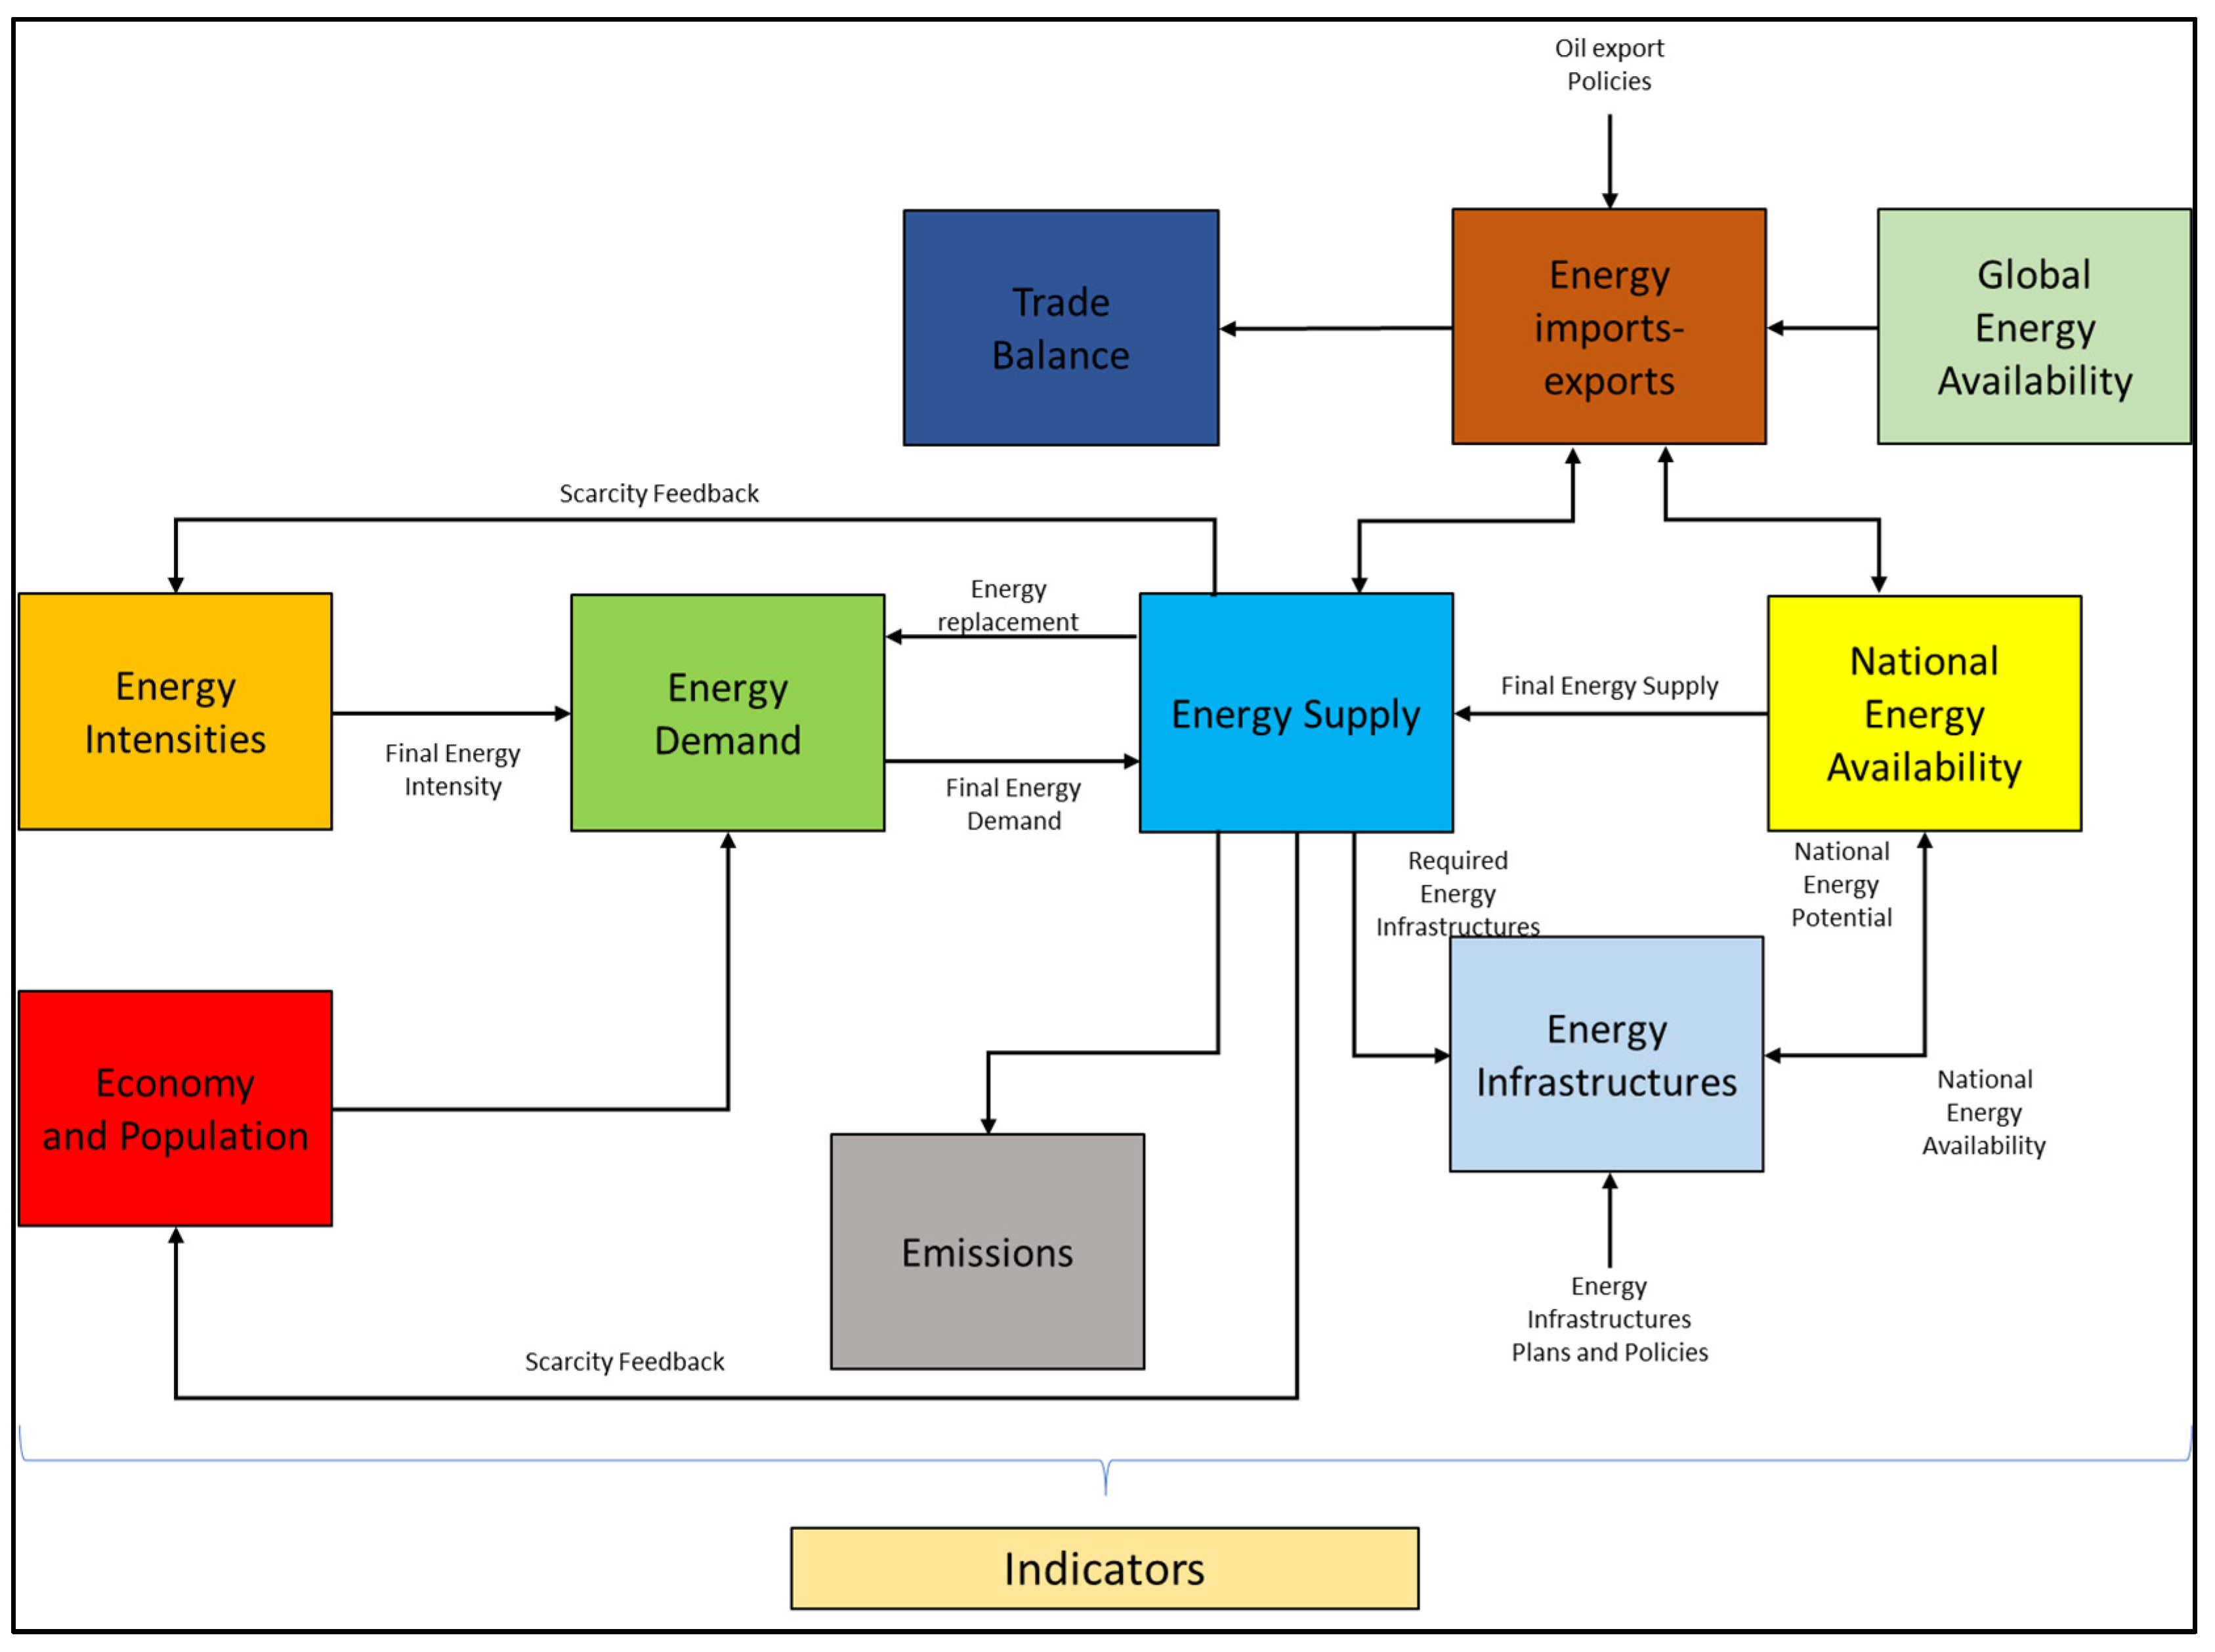
2. Materials and Methods

In this section, an overview of the Ecuadorian energy context will be presented first, followed by the description of the EEDEC model and scenario design.
Ecuadorian primary energy production is composed mainly of oil, which in 2020 made up 86% of the total. On average, around 72% of total oil extracted is exported, whereas the remaining goes to local refineries. Hydro covers around 7% of primary production, and the remaining 7% is composed of natural gas, biomass, and other primary sources. Regarding secondary energy production, electricity holds the largest share with around 30% of total, followed by fuel oil (26%), diesel oil (15%), and gasolines (13%) [42].
Energy demand has been historically dominated by the transport sector, which in 2020 took 45% of total final energy, far above the 17% used by industry and the 15% consumed by households. Such a large demand in transport is reflected in the share of fuels used, where the largest contributors are diesel oil (31%) and gasoline (26%). Electricity and LPG are important energy sources used in households and commercial sectors that make up another 31% of the share [42].
Due to limited refining capacity, gasoline and diesel production are not enough to meet demand. Around 69% of diesel and 70% of gasoline used are imported. In this sense, access to global oil products trade constitute a vital matter for the Ecuadorian state. LPG represents another 12% of total energy consumption and presents the same limitations of diesel and gasolines, as about 85% of it must be imported to meet the demand [43]. Electricity demand represented 19% of total demand in 2020, requiring almost no imports.
Oil reserves are around 8.3 billion barrels in proved reserves, (considering both extracted and remaining oil) [44]. Considering proved reserves, Ecuador has exploited around 71% of its reserves by 2020. According to the Oil Potential Report published by the Ecuadorian Secretariat of Hydrocarbons in 2018, 2P (proved and probable) reserves were updated to around 8.5 billion barrels, while the most optimistic 3P (proved, probable, and possible) reserves including contingent and yet-to-find resources were estimated in 10.9 billion barrels [45].
Ecuador has extracted on average 190 million barrels [MBbl] of oil per year between 2010 and 2020 [42], reaching a peak in 2014 with 203 MBbl. In 2020, Ecuador exported 126.4 MBbl of oil, which represented around 72% of the total production [42]. Crude oil represented 49% of the total export earnings and 24% of the government revenues in 2020, while the oil industry accounted for 9.5% of GDP of in the same year. On average, oil extraction and related services has represented 10.6% of total GDP [46,47]
Ecuador has experienced major change in its electricity mix in the past 15 years. In 2010, fossil generation had the largest share with 54% of total installed capacity, followed by hydro with 44% and 2% nonconventional renewable energy (solar PV, wind, and biomass) [42]. Following the development of large hydropower projects, installed capacity in 2020 was led by hydro (59%), while fossil thermal fell to 39% and other renewables stayed at about 2%. Electricity imports and exports were also affected and by 2016, electricity exports to neighboring countries Colombia and Peru exceeded imports for the first time [48].
The economically feasible hydropower potential is estimated to be 22,000 MW [40]. In the case of solar energy, the national solar average insolation is 4.575 Wh/m2/day, reaching maximums around 5748 Wh/m2/day in some zones of the country, which are considered suitable conditions for the development of solar photovoltaics [49]. Other studies indicate solar PV has a complementary potential to hydropower of 16,637 MWp [50]. The potential for wind capacity is estimated to be around 884 MW [51]. Finally, biomass potential capacity has been assessed to lie near 500 MW, while geothermal capacity, located mainly in the volcanic areas in the Andean region of the country, could reach 900 MWe [40].
Future planning of power sector in Ecuador is mainly guided by the Electricity Master Plan (EMP) and the National Plan of Energy Efficiency (NPEE). The first forecasts power demand under different scenarios, and provides the guidance to build the required generation, transmission, and distribution infrastructure to meet the power demand in the proposed scenarios. The current version of the EMP covers the period 2018–2027 [51].
The second serves as the main policy guidance document for the implementation of energy efficiency measures covering the period 2016–2035. The plan defines six main energy efficiency pivotal points: legal, households, industry, transport, energy own use, and measures in the Galapagos Islands [52].
Ecuadorian Energy Development under Energy Constraints (EEDEC) is system dynamics in a simulation model that allows the integration of different perspectives and feedback from variables that are part of Ecuador’s energy system [53]. The model has been used as a structural reference for some of its subsystems, the model MEDEAS, and model WoLiM [23,54]. It was developed in Vensim DSS software, it runs from 2000 to 2050, and manages 14 energy sources. The main modules are energy demand, energy availability, energy infrastructures, emissions, and energy indicators. Figure 1 depicts the schematic overview of the model. The boxes depict the main outputs of the model, whereas arrows represent the main variables used in the model to generate these outputs and the dependence between outputs. A brief description of the modules is presented, whereas a full description of the model is found in [53] and in Supplementary Material in this paper.
Energy Demand: For estimating energy demand, two approaches have been considered: (1) a top-down approach that uses projected economic activity, households’ consumption, and energy intensity [55]. The latter will vary based on both efficiency improvements and source substitutions that depend on policies, and physical scarcity of energy sources; (2) a bottom-up approach that considers subsectors and technologies used. Household’s transport, freight, and passenger transport. Energy intensity will depend on the share that considered technologies might have according to implemented penetration policies.
Energy Availability: The availability of renewable and non-renewable sources is subject to biophysical and temporal constraints. Availability of national primary non-renewable sources (oil and natural gas) is restricted by stocks and flows. Intermittency of variable renewables is addressed by computing overcapacities that depend on its penetration in the mix. Energy availability, specifically for oil and oil products, will include the interactions with the global context considering inputs from the MEDEAS world model [23].
Energy Infrastructure: This module includes infrastructures for electricity generation, oil refining, and biofuels production (ethanol specifically)—the first considering planning and construction delays. Electricity generation from renewables is prioritized to cover demand and capacity expansion will depend on requirements, policies implemented, and resource potential available.
Emissions and energy transition indicators: Greenhouse gas (GHG) emissions from energy use are quantified in this module. Energy transition scenarios are evaluated based on the indicators proposed by the International Energy Agency (IEA) [56]. The model also calculates the fossil fuels trade balance based on prices depicted in IEA World Energy Outlook 2020 and the World Energy Model [57].
EEDEC dynamically works based on the following logic: For each period, sectoral economic activity projections based on Gross Domestic Product is set. Energy demand is computed based on economic activity and energy intensities for each sector and source. Energy supply will depend on national and global availability of energy sources and energy infrastructures to fulfill the demand. If availability of national resources is not enough to satisfy the demand, energy imports will be needed, and the amount of energy to be imported will depend on the global supply of the source and the share that the country has in world demand. In case of energy scarcity, a pressure to improve energy intensity, substitution for more abundant sources, and a higher penetration of new technologies will occur considering limits imposed by historical data and both national and global perspectives. After maximum limits of reducing energy intensity and substituting energy sources are reached, economic activity is adjusted based on energy supply. GHG emissions, energy transition indicators, and fossil fuel trade balance are calculated.
Six scenarios were constructed to evaluate the impact of energy transition policies using the EEDEC model. For every scenario, a set of assumptions regarding technology perspectives, global energy context, national and global energy availability, and policy implementation are used based on a specific storyline. Possible future states were built based on the qualitative storylines of a combined multidisciplinary view of energy transition scenarios for Ecuador [58,59]. Projections of economic activity for all scenarios consider the expected changes in the region due to the pandemic for 2020, 2021, and 2022 [60]. From 2023 onwards, it is assumed that GDP average annual growth rate would follow pre-pandemic decade (2010–2019) trends (2.7%), which is in accordance with previous studies [29].
The first two scenarios depict a Business as Usual (BAU) storyline that will be the base to compare policies in place with more ambitious energy transition strategies. In this scenario, variations of energy demand under a top-down approach are based on historical energy intensity trends obtained as an analysis of energy statistics [48,61,62,63]. Regarding bottom-up modeling for road transport, penetration of alternative technologies (hybrid, electric vehicles) is to follow current trends as well. In the case of infrastructures for energy supply, specifically oil refining capacity and yield, will remain with current values [64]. Regarding oil, the country will seek to export the maximum amount possible based on availability. Fossil fuels’ prices (including oil, oil products, and natural gas), are expected to follow the stated policies scenario of [57]. For electricity generation, the most conservative case of current expansion plans is considered [40].
The second set of scenarios involve a conservative effort towards energy transition (CEET). Policies focused on improving energy intensity and source substitution are considered with moderate targets. The replacement of oil products for electricity is one of the main drivers following the action lines stated in the National Plan for Energy Efficiency [65]. Regarding oil, exports will be reduced compared to BAU scenarios considering the amount of oil embedded in petroleum product imports plus a fraction of national oil demand. For electricity generation, CEET scenarios include the most ambitious case according to current national plans [51]. After current plans are implemented, average growth rates for renewables capacity are considered. Fossil fuels’ prices are expected to follow the sustainable development scenario of [57].
The third set of scenarios encompass a maximum effort towards energy transition (MEET). More ambitious policy targets compared to CEET scenarios are implemented for improving energy intensity and source substitution. Additional strategies such as use of biomass in industry and non-motorized mobility are included. To avoid a rapid decline in oil reserves, an export policy of oil sovereignty is implemented, which means that the country will export only the amount of oil embedded in imported petroleum products necessary to cover domestic demand. Although MEET scenarios include the same case of power capacity expansion as CEET [51], higher growth rates for renewables power capacity are considered after current plans are implemented. Fossil fuels’ prices will follow the same trend as in CEET scenarios (Table 1).
In all energy transition scenarios, oil refining infrastructures are expected to remain unchanged. Main assumptions regarding efficiency improvement, source substitution (for a top-down approach in industry, commercial, others, and households), and technology penetration targets (under bottom-up approach for road commercial transport and for households’ transport) were developed based on a literature review [27,34,38,66,67,68,69,70,71,72,73,74].
For all scenarios, national oil availability was analyzed based on the study developed by [43]. Two values of ultimate recoverable resources (URR) are considered (7800 [MBbl] and 10,700 [MBbl]). Regarding fossil fuels’ global availability, imports are constrained by oil and natural gas supply taken from [23] and the share that the country has had in total world demand.
Table 2 presents the main assumptions and bounds of each storyline, and Supplementary Material offers a detailed description.

3. Results

This section presents the simulation results of the EEDEC model for scenarios BAU_2P, BAU_O, CEET_2P, CEET_O, MEET_2P, and MEET_O. Energy supply (electricity generation, petroleum products production, and oil extraction) is presented first. Then the effects of energy scarcity, and policies for energy intensity improvement and source substitution on energy demand and economic activity are analyzed. Emissions, and energy transition indicators for each scenario are described in the end.

3.1. Energy Supply

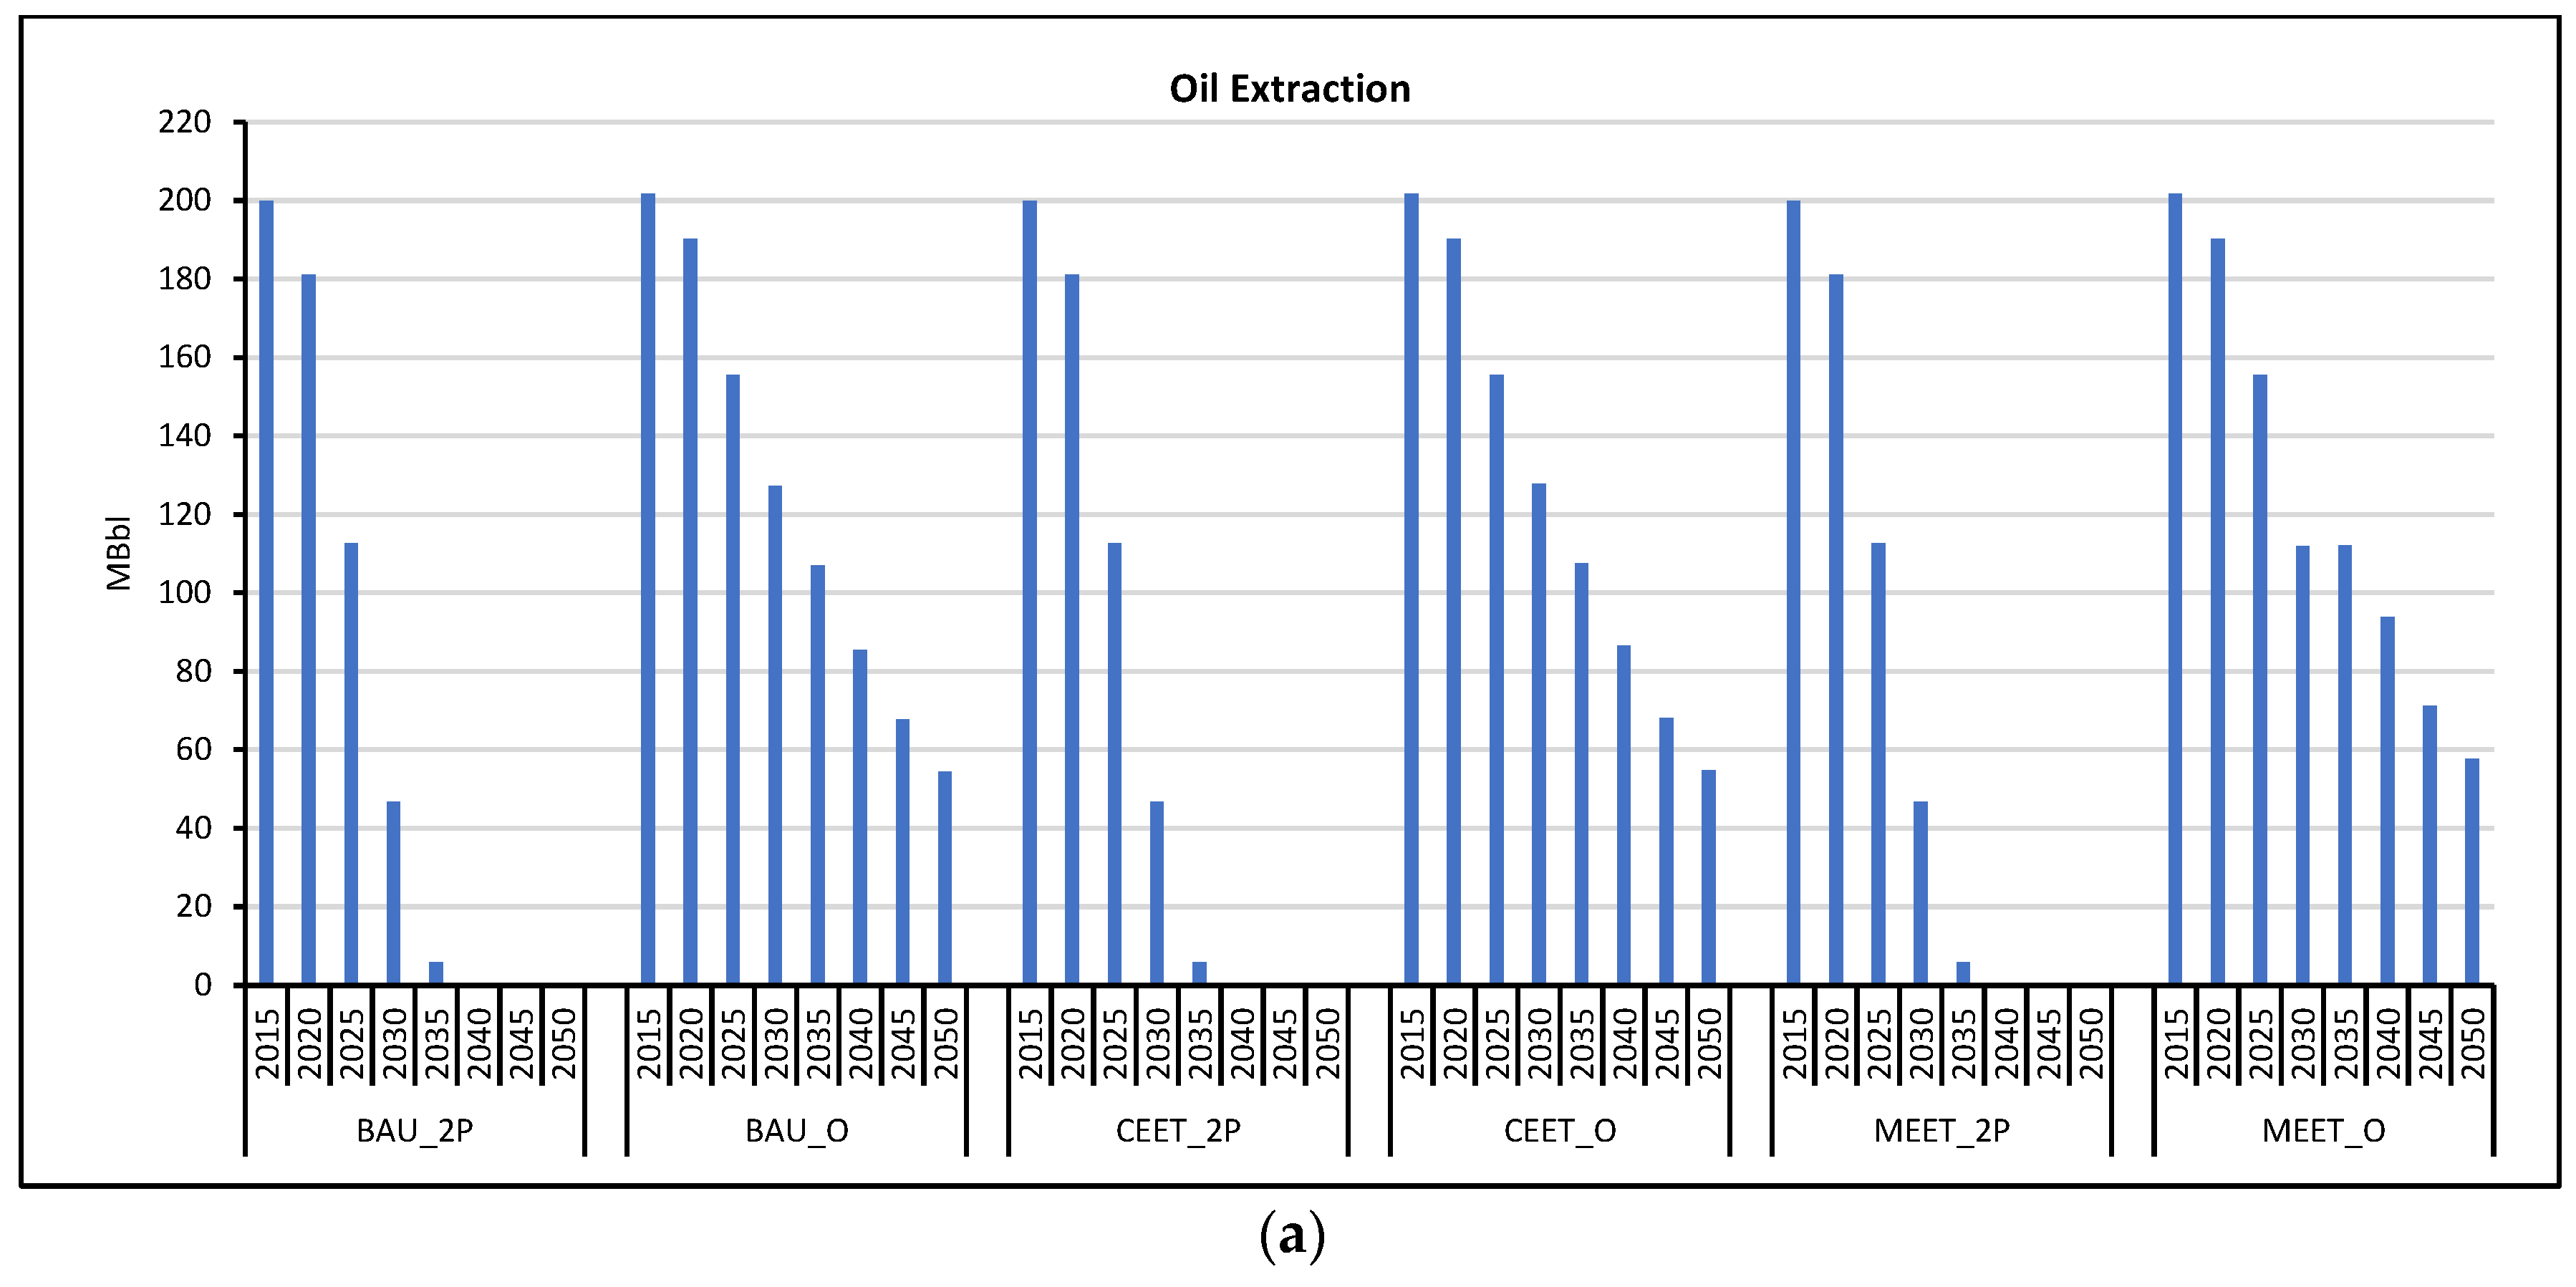
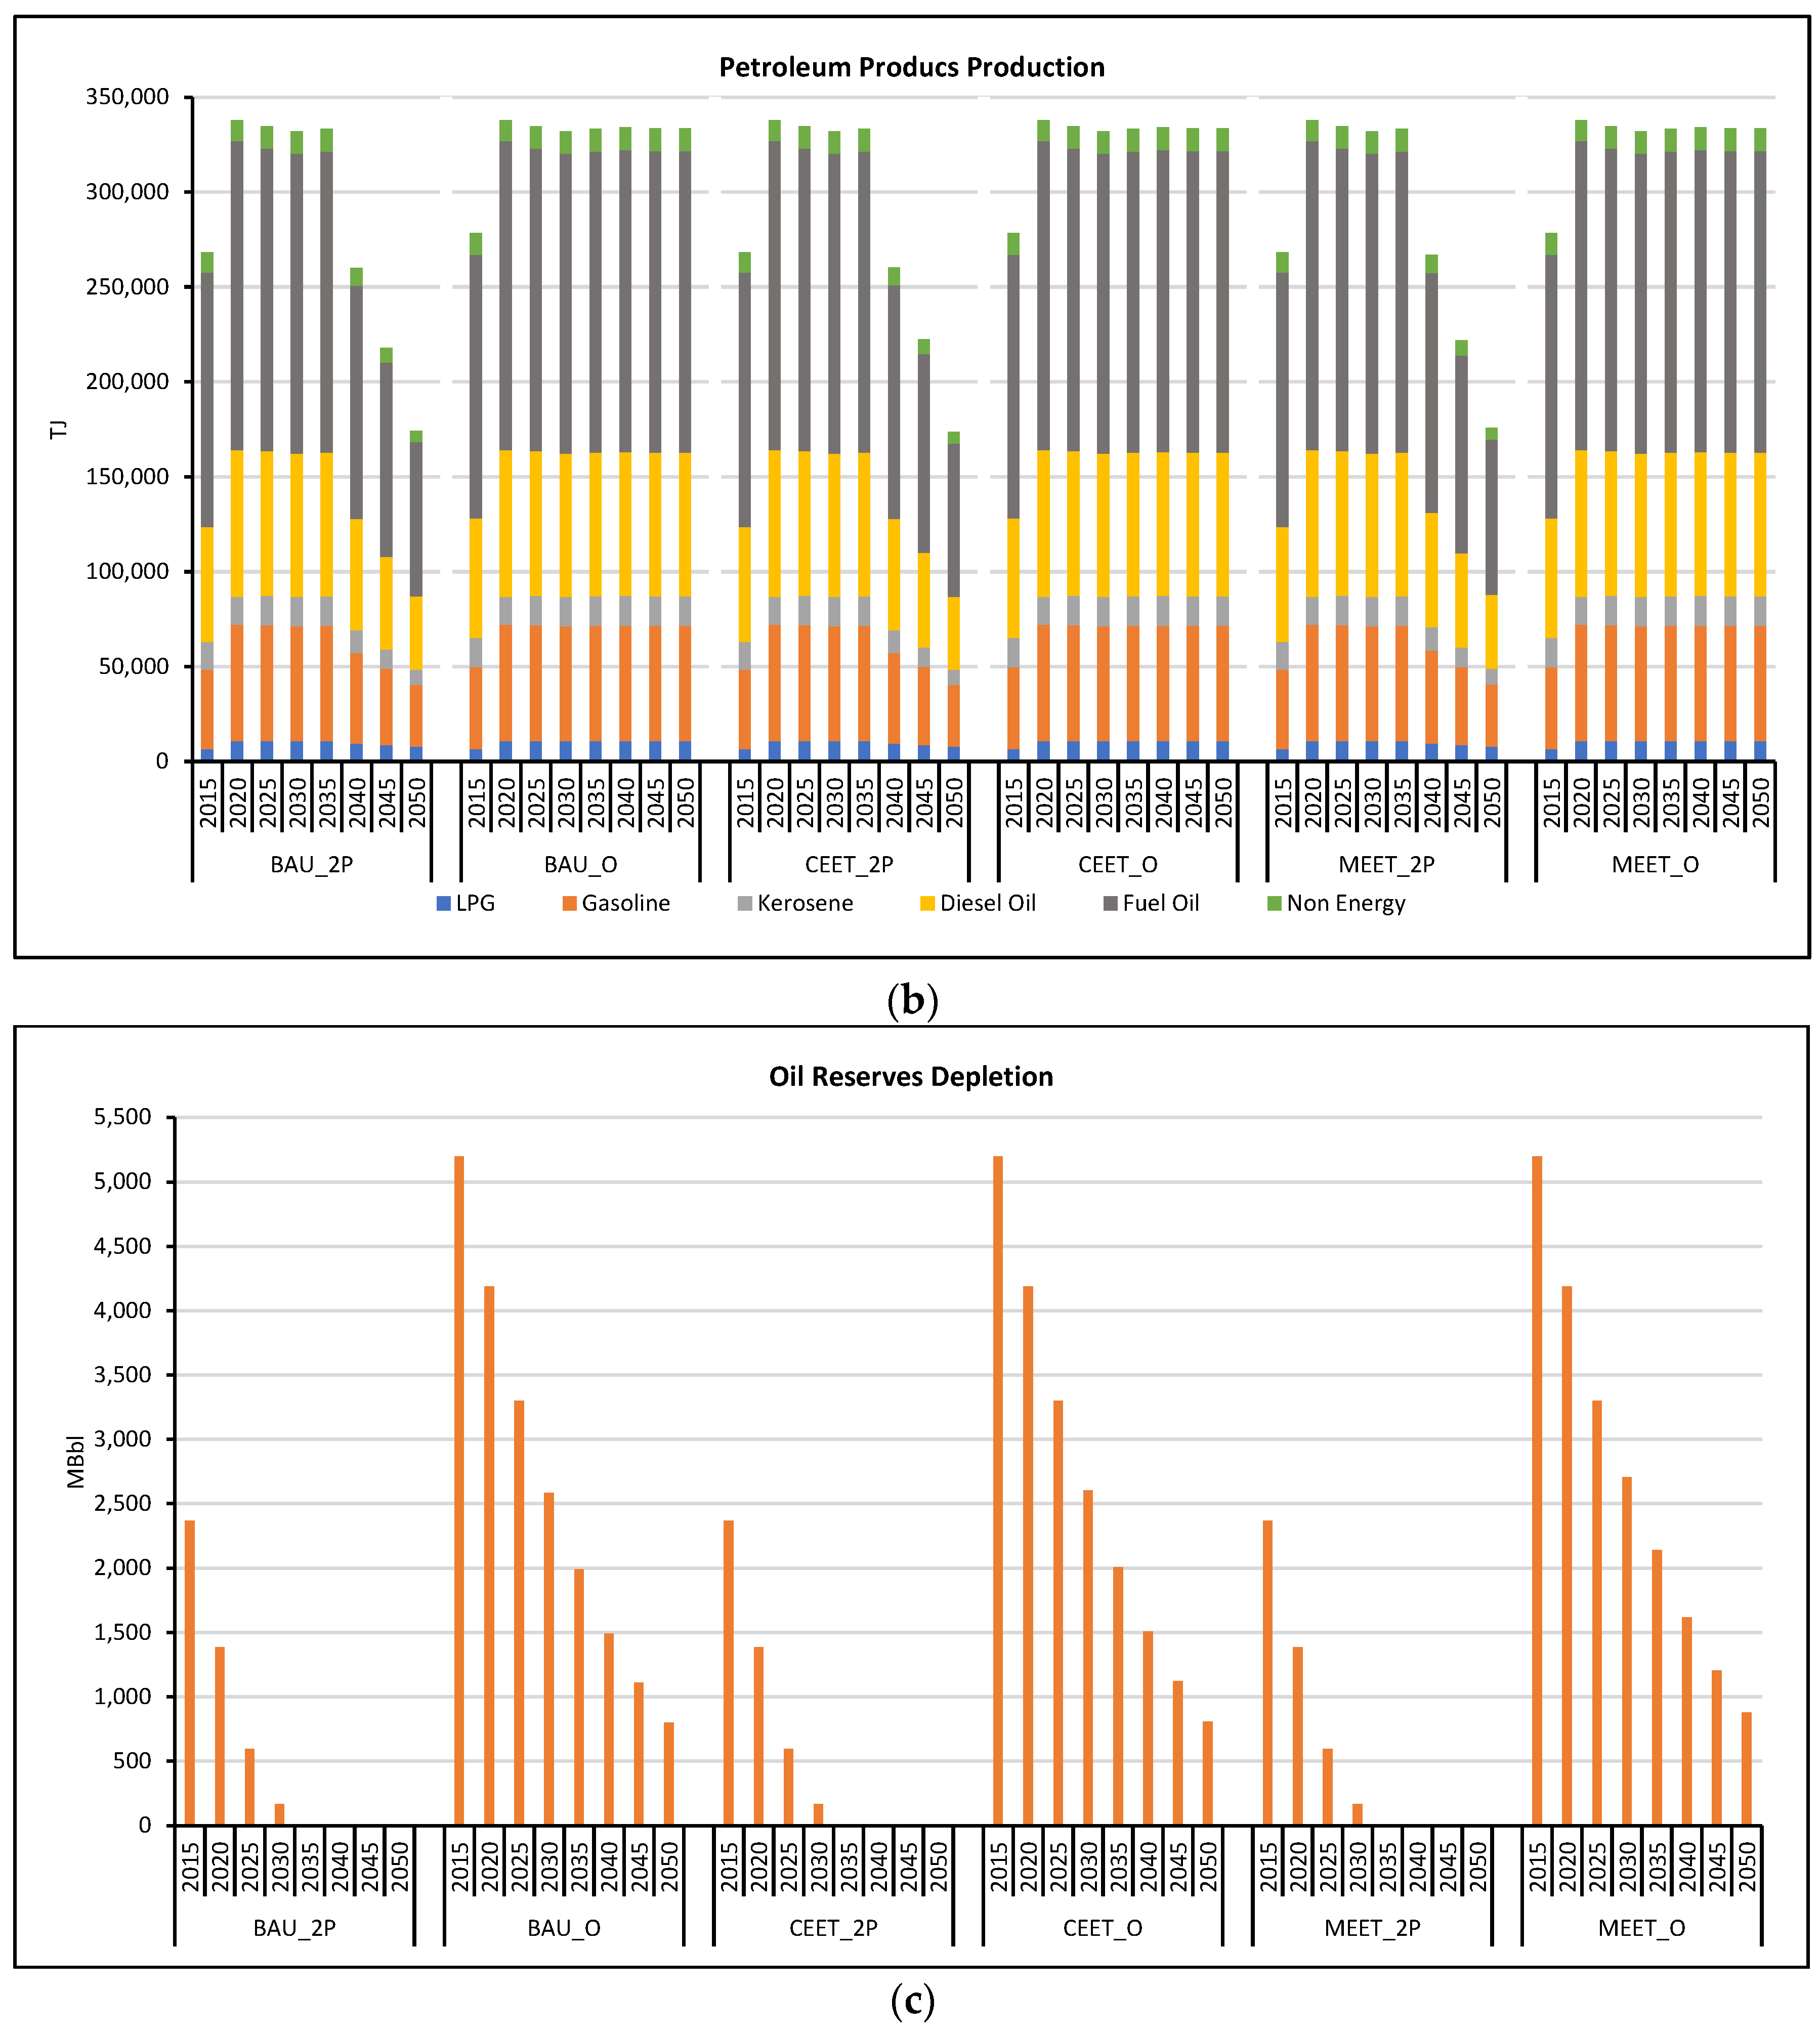
3.1.1. Oil Extraction and Petroleum Products Production
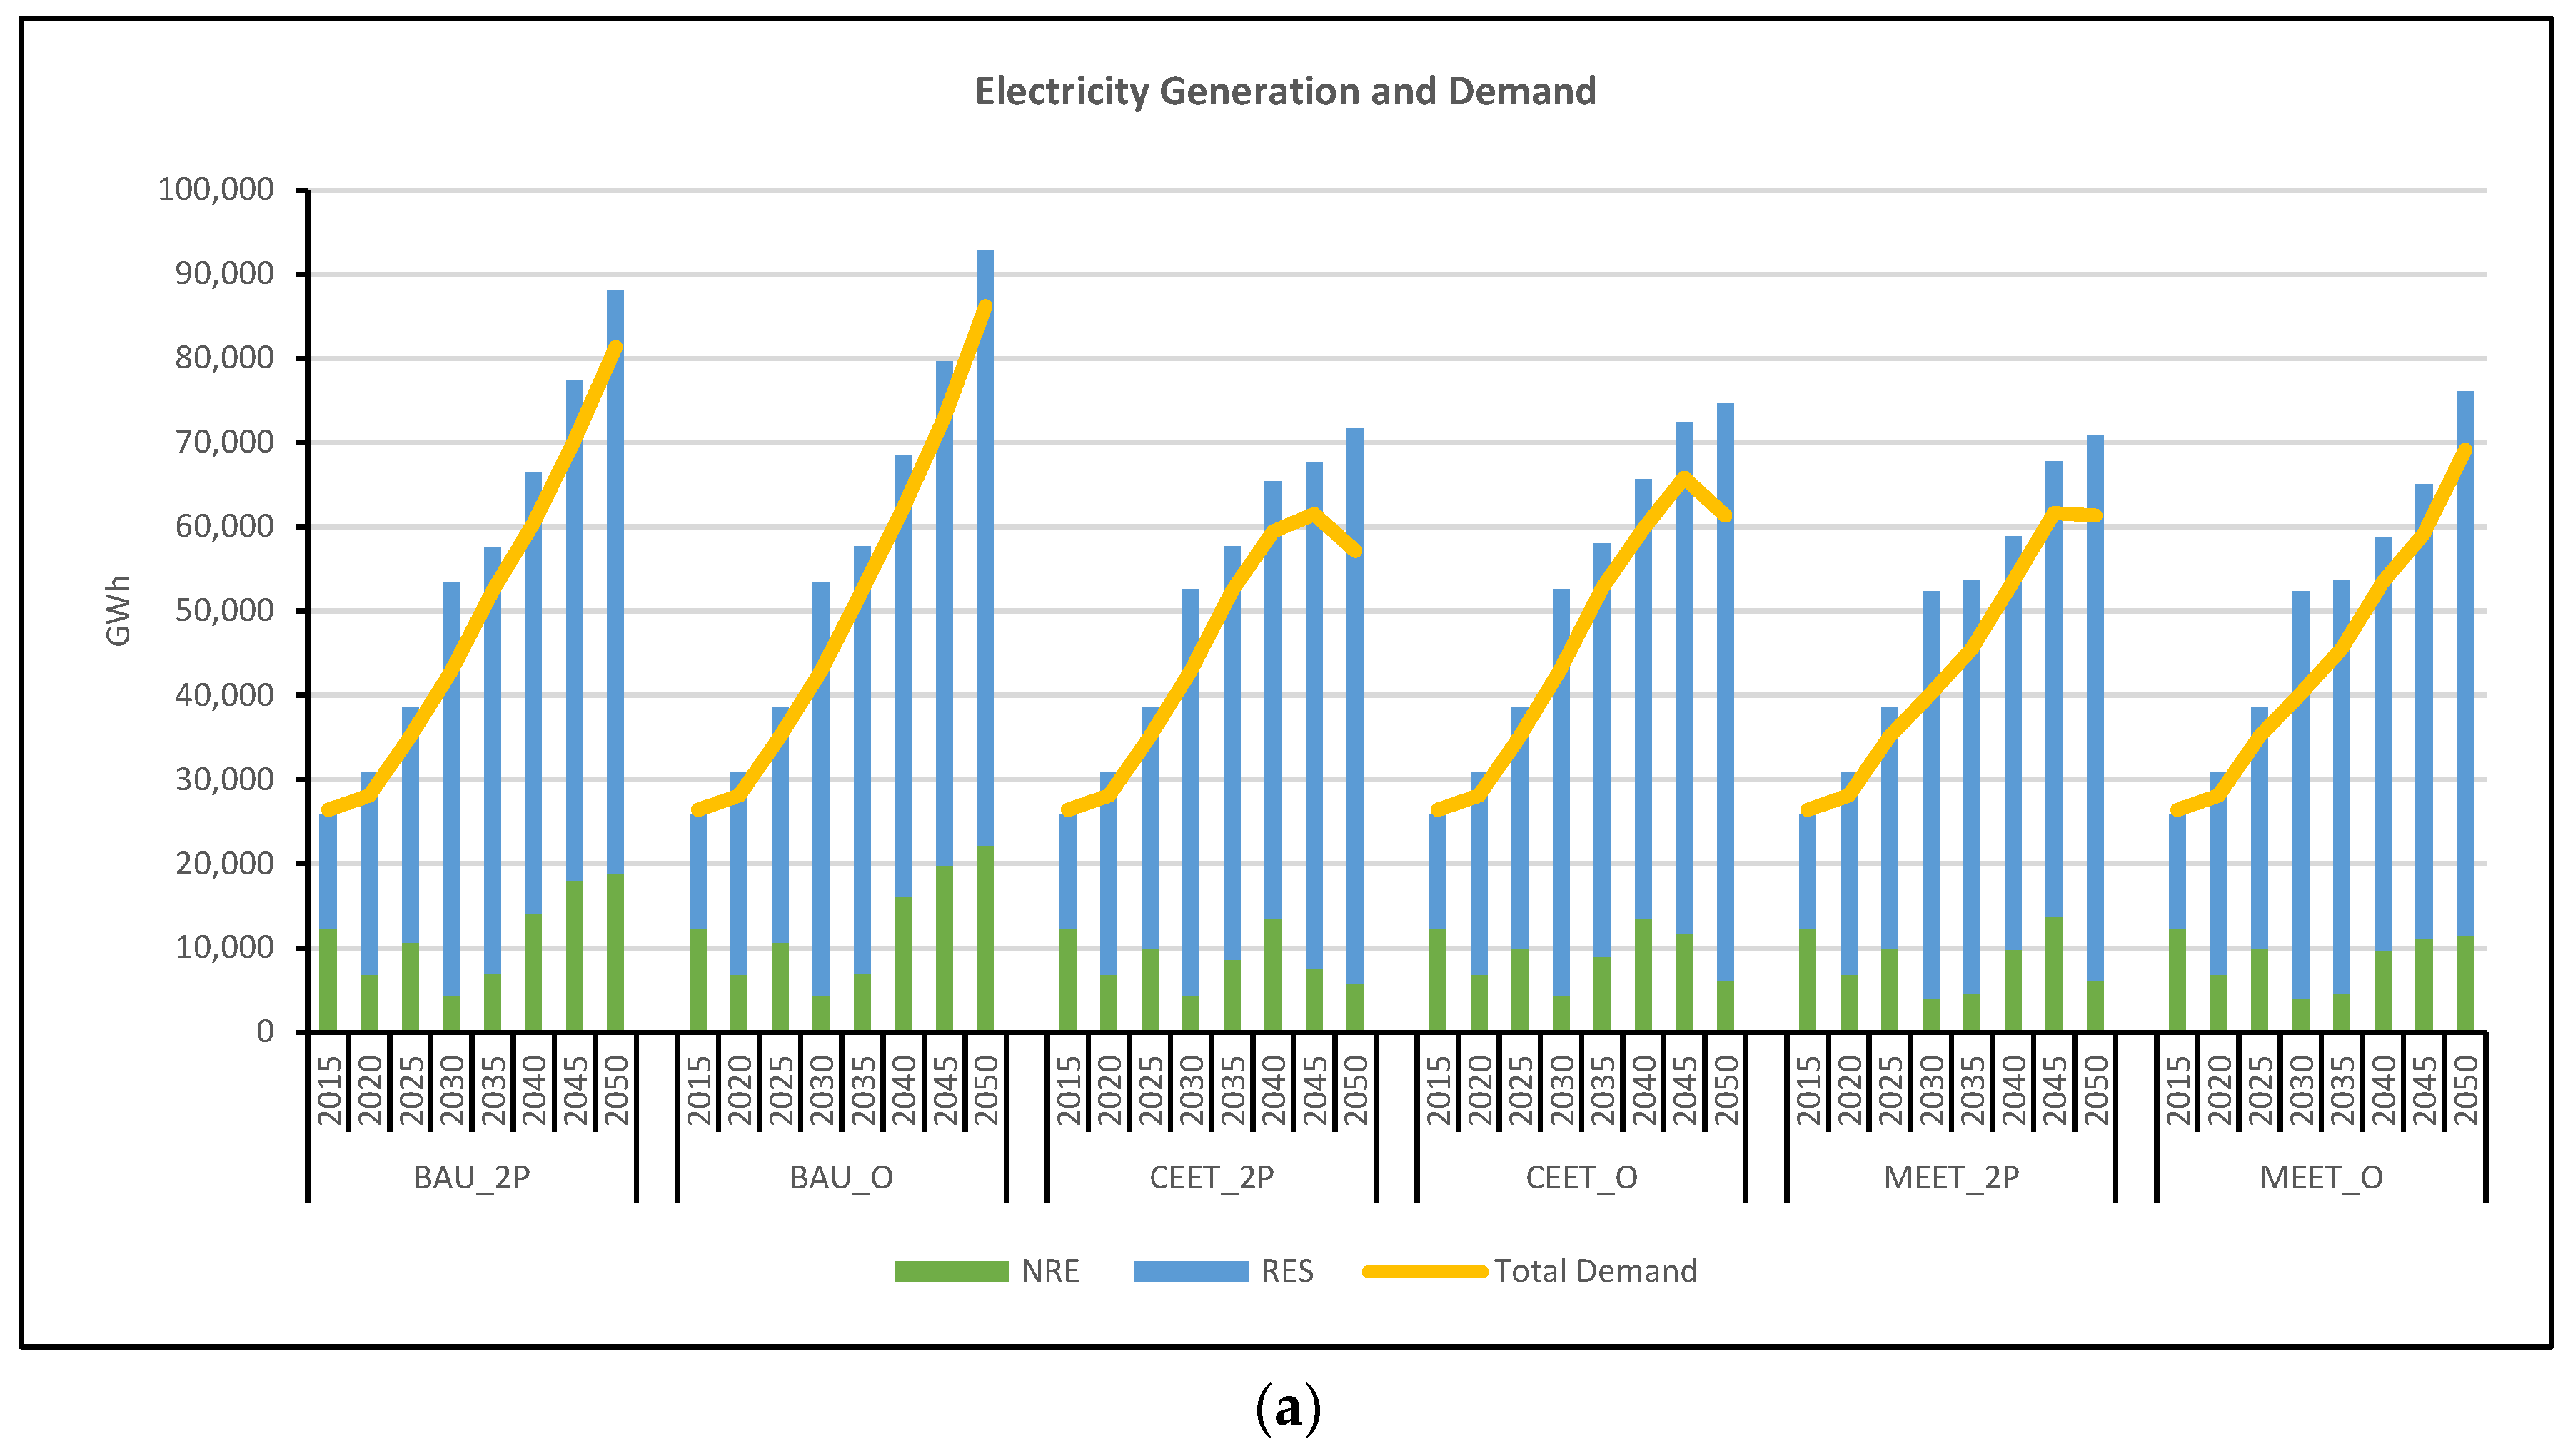
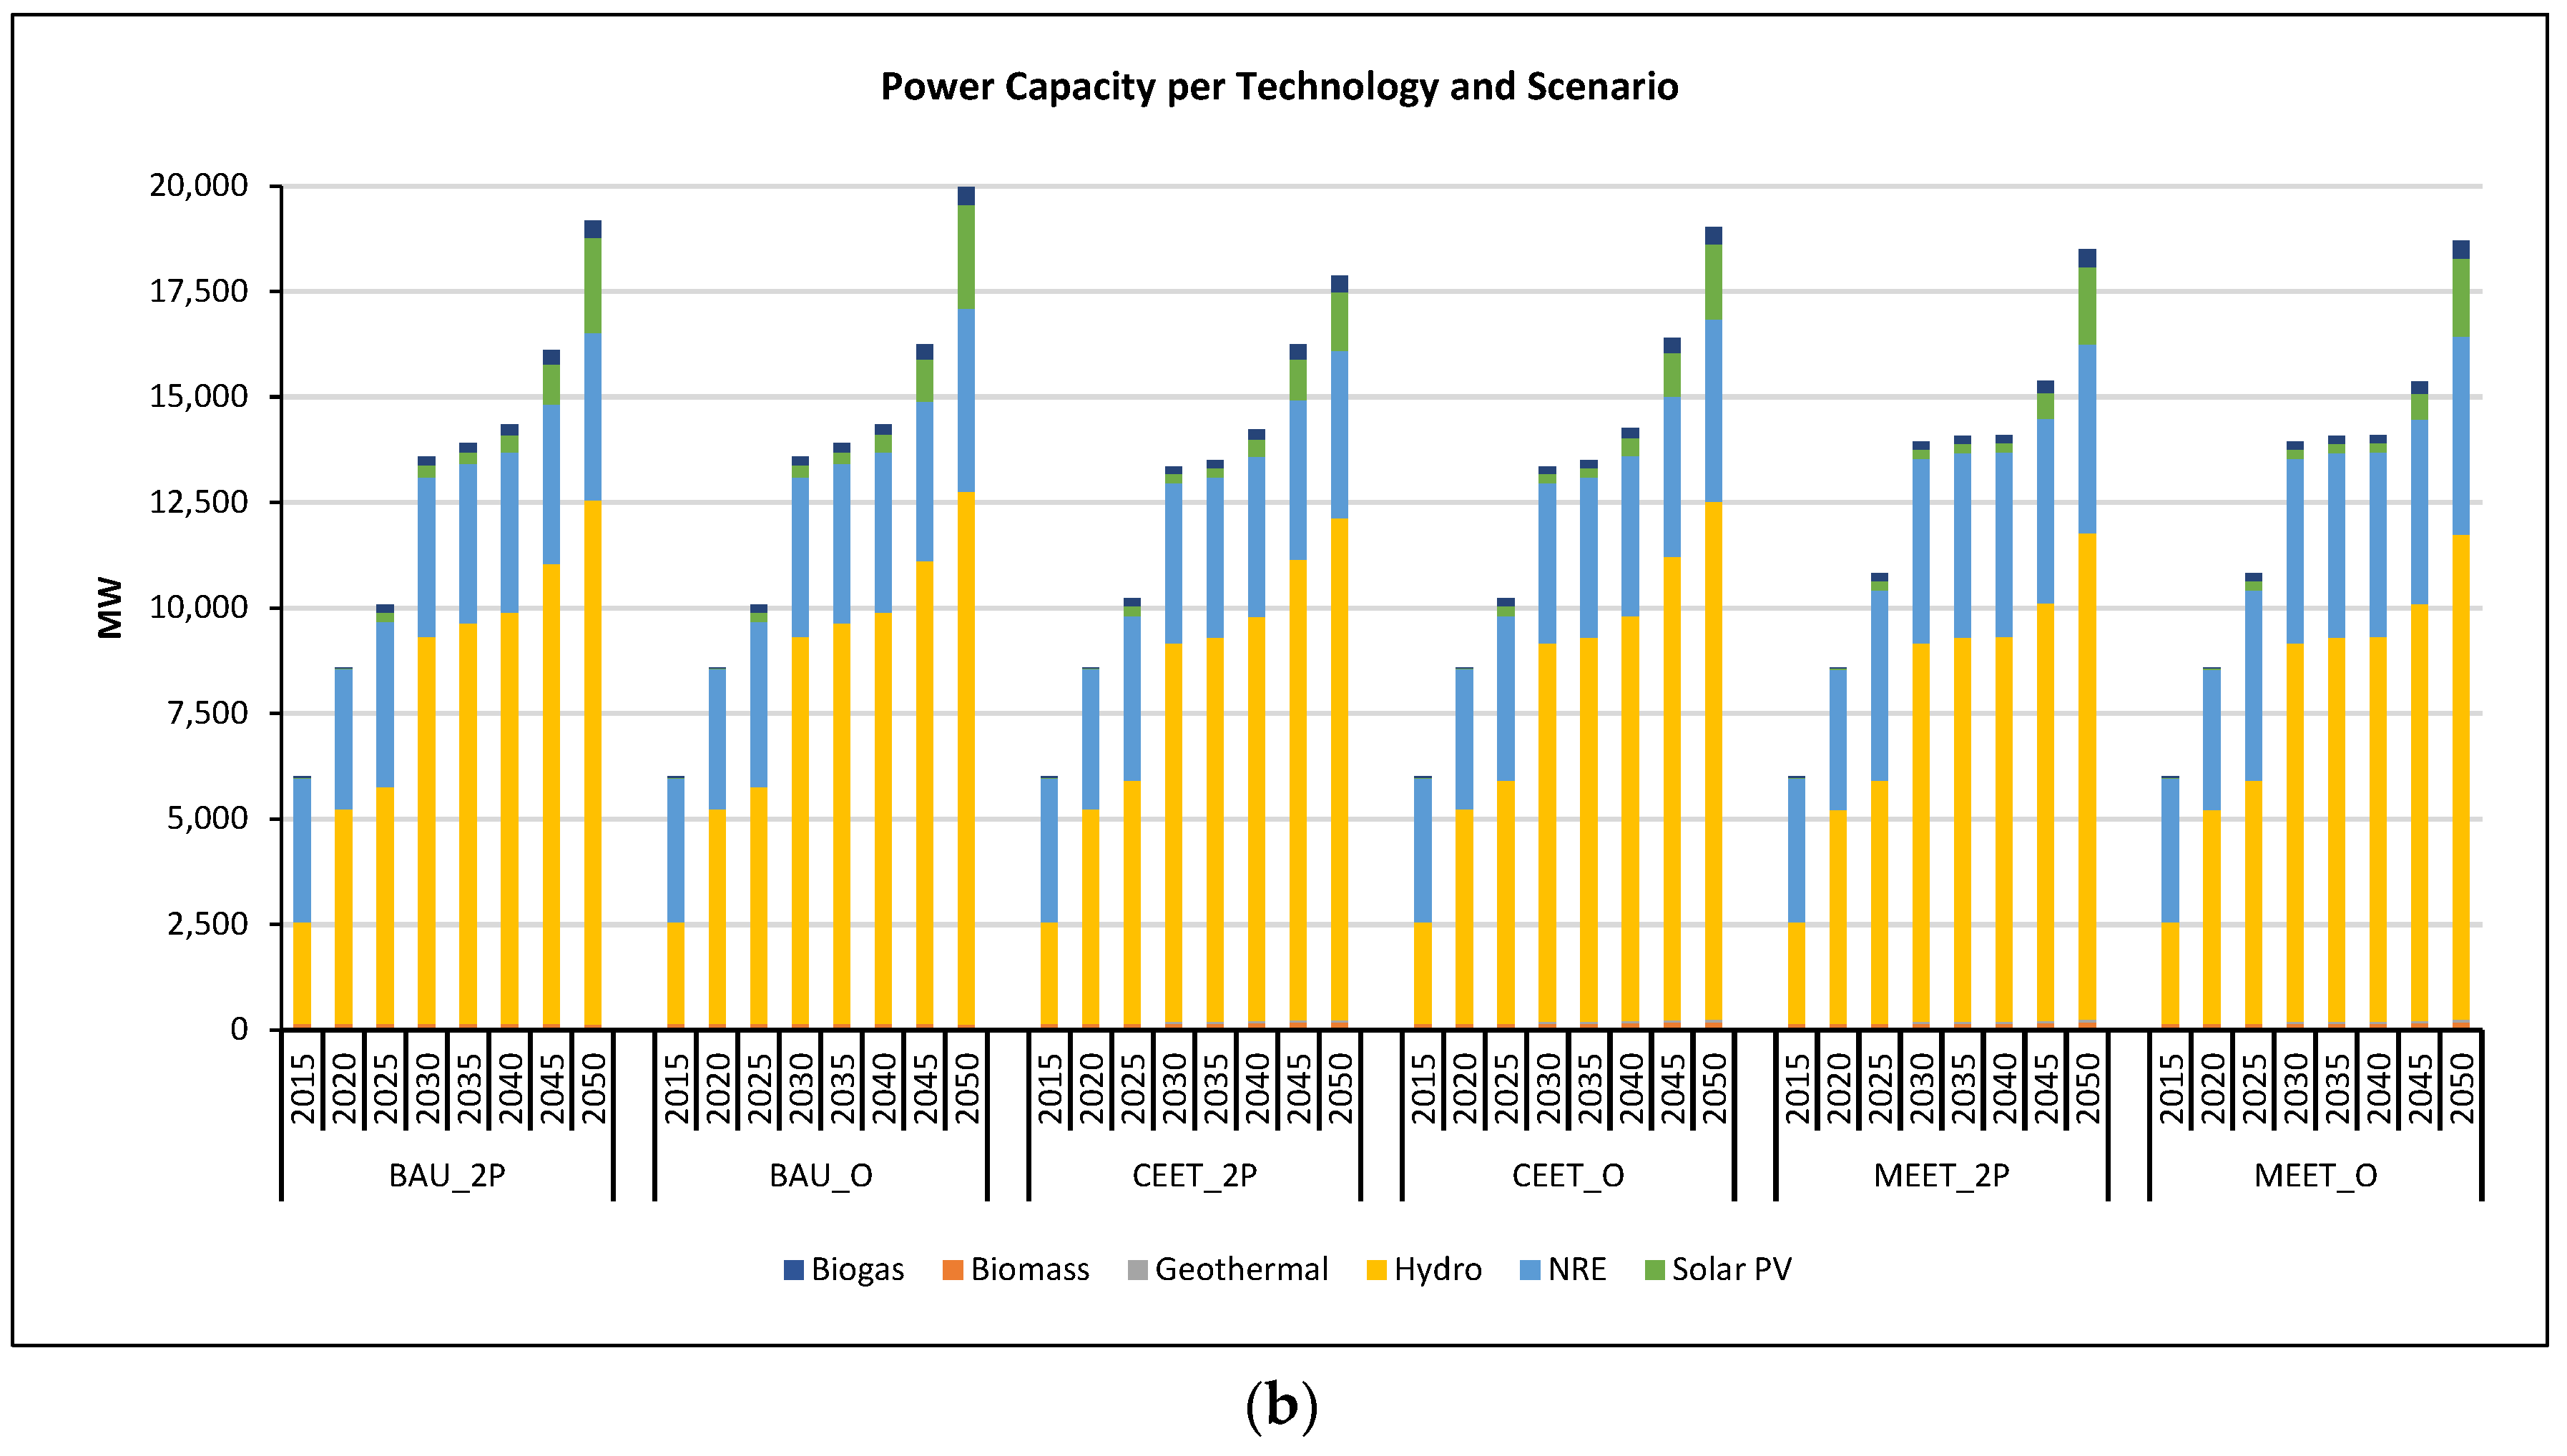
The evolution of oil extraction, petroleum products production, and oil reserves depletion are presented in Figure 2a–c. Scenarios with oil availability of 7800 MBbl (2P) depict a steep decline in production of petroleum products by the next decade, due to a decay in oil reserves and restricted access to oil imports. Moreover, strategies focused on reducing oil exports might not have effects on delaying and reducing reserves depletion (results not shown), and by 2040, the country might have run out of oil. Under oil availability of 10,700 MBbl (O) scenarios show a steady production of petroleum products during the period under analysis, which reduces imports.
For the same amount of oil reserves, similar performances are obtained for oil supply, regardless of the scenario (BAU, CEET, and MEET). Given that scenarios are equally affected by the biophysical limits in extraction and the limits of current refineries installed capacity, there is no room for action in this supply area.

3.1.2. Electricity

If current trends persist in the use of electricity (Figure 3a), by 2050, demand would be between 3.1 and 3.3 times its value in 2020 (BAU_2P and BAU_O scenarios, respectively). For CEET scenarios, the effect of policies focused on improving energy intensity of electricity would result in a demand 30%, and 29% lower by 2050 compared to BAU. Regarding MEET scenarios, ambitious policies to improve energy intensity and increase in the use of electricity in detriment of fossil fuels might result in a demand 7.4% and 12.8% higher than CEET scenarios by 2050. Policies focused on improving the use of electricity are a key factor to avoid an abrupt increase in demand given the substitution policies applied in a sector such as households (including transport), industry, and commercial.
All scenarios analyzed depict a reduction in electricity from fossil fuels, reaching the lowest point in 2030 (around 8%) due to the planned expansion of installed capacity, specially from hydropower (Figure 3b). In BAU scenarios, electricity from NRE increases its share after 2030 indicating that current trends on the development of RES might not be capable of reducing the use of fossil fuels in electricity, which would increase their share by 2050 (around 23%). In the case of CEET scenarios, the rise of electricity demand might pressure the system to increment generation from NRE up to 2040, to later decrease, and reach in 2050, similar values as of 2030 (around 8%). In the case of MEET_O scenario, the share of NRE remains relatively constant from 2040 to 2050 with an average value of 16%. This indicates that the most ambitious case of introduction of renewable energy for electricity generation would not be able to cover the massive substitution of oil products. However, the contribution of NRE in total electricity generation would still present important reductions compared to BAU. It is noted that scenarios with a larger availability of national oil (BAU_O, CEET_O, MEET_O) present a higher share of NRE in the mix.
Installed capacity shows hydropower as the most important source in the mix with an average share of 64–67% from 2030 to 2050 depending on the scenario (Figure 3b). Solar PV capacity would reach shares between 8% to 12% by 2050, and wind capacity might represent 2–2.3%. Regarding the rest of the renewables considered (Biomass, Biogas, and Geothermal), their combined share by 2050 would be in the range of 0.7–1.3%. Even in the most optimistic scenario of deployment of renewables, nearly 15% of the electricity produced might come from fossil fuels.
CEET and MEET scenarios result in a lower electricity generation and demand, but with similar amount of total power capacity to BAU scenarios that would allow the country to export electricity to Colombia and Peru.

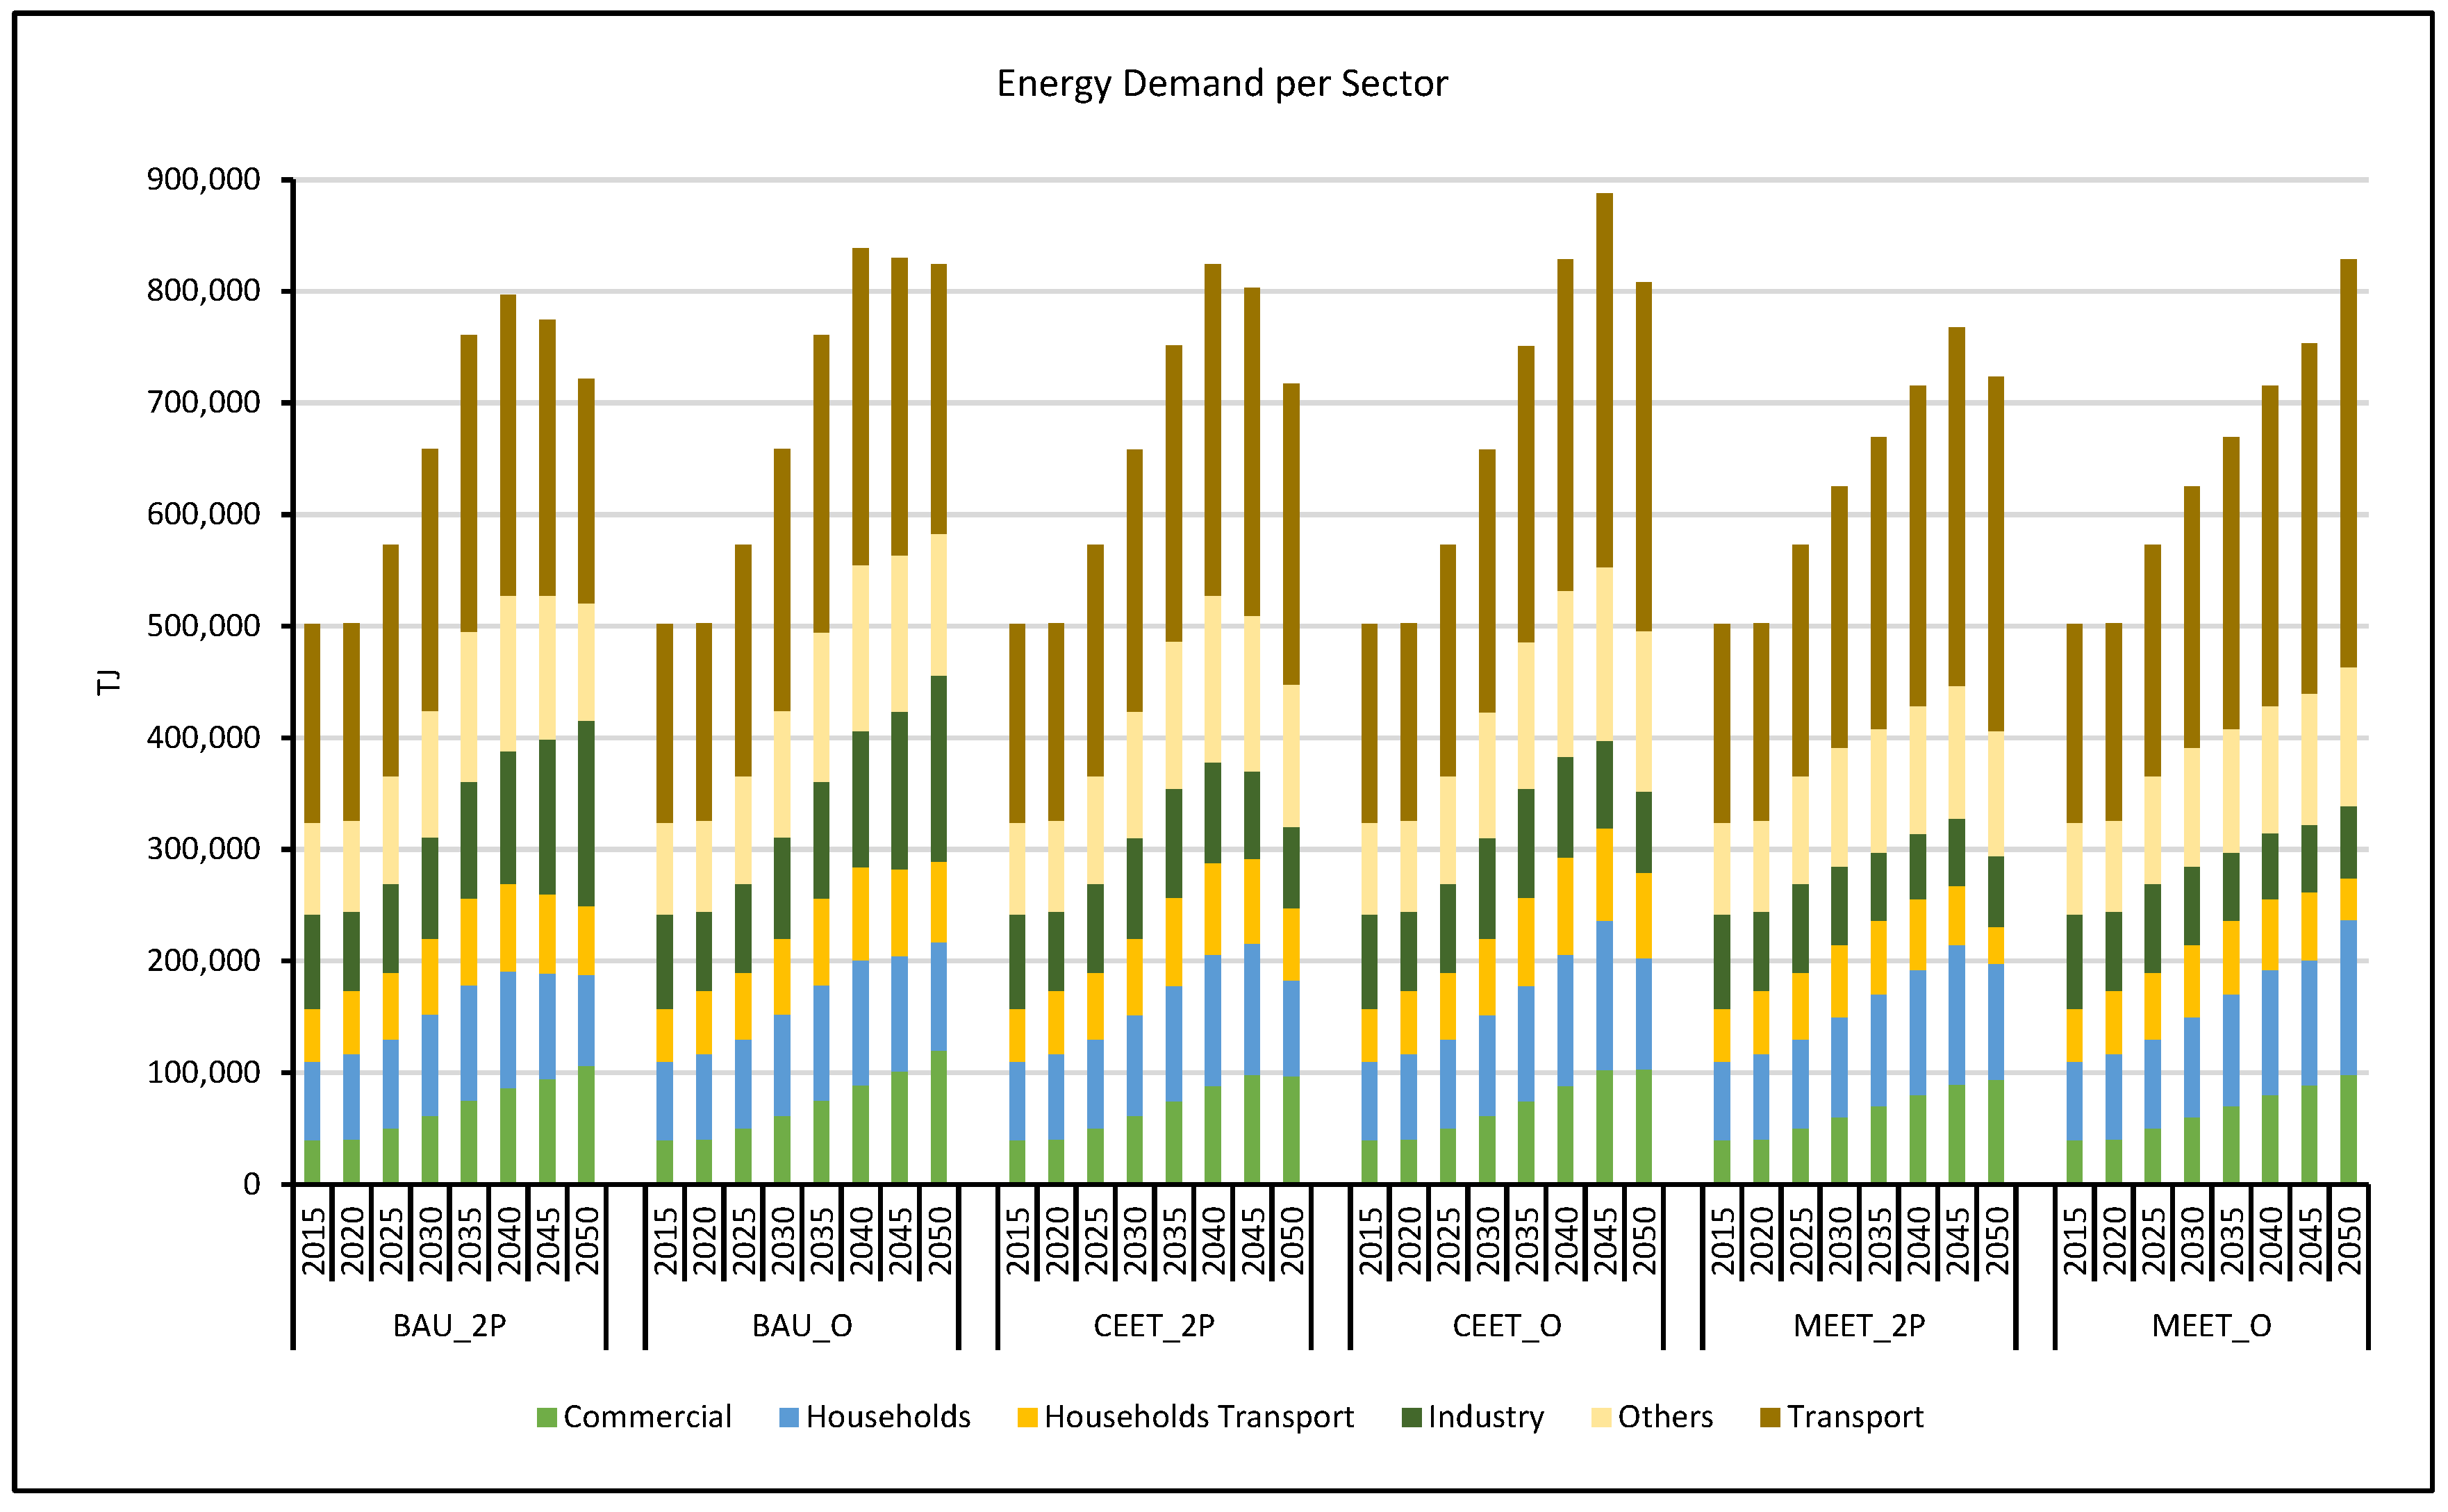
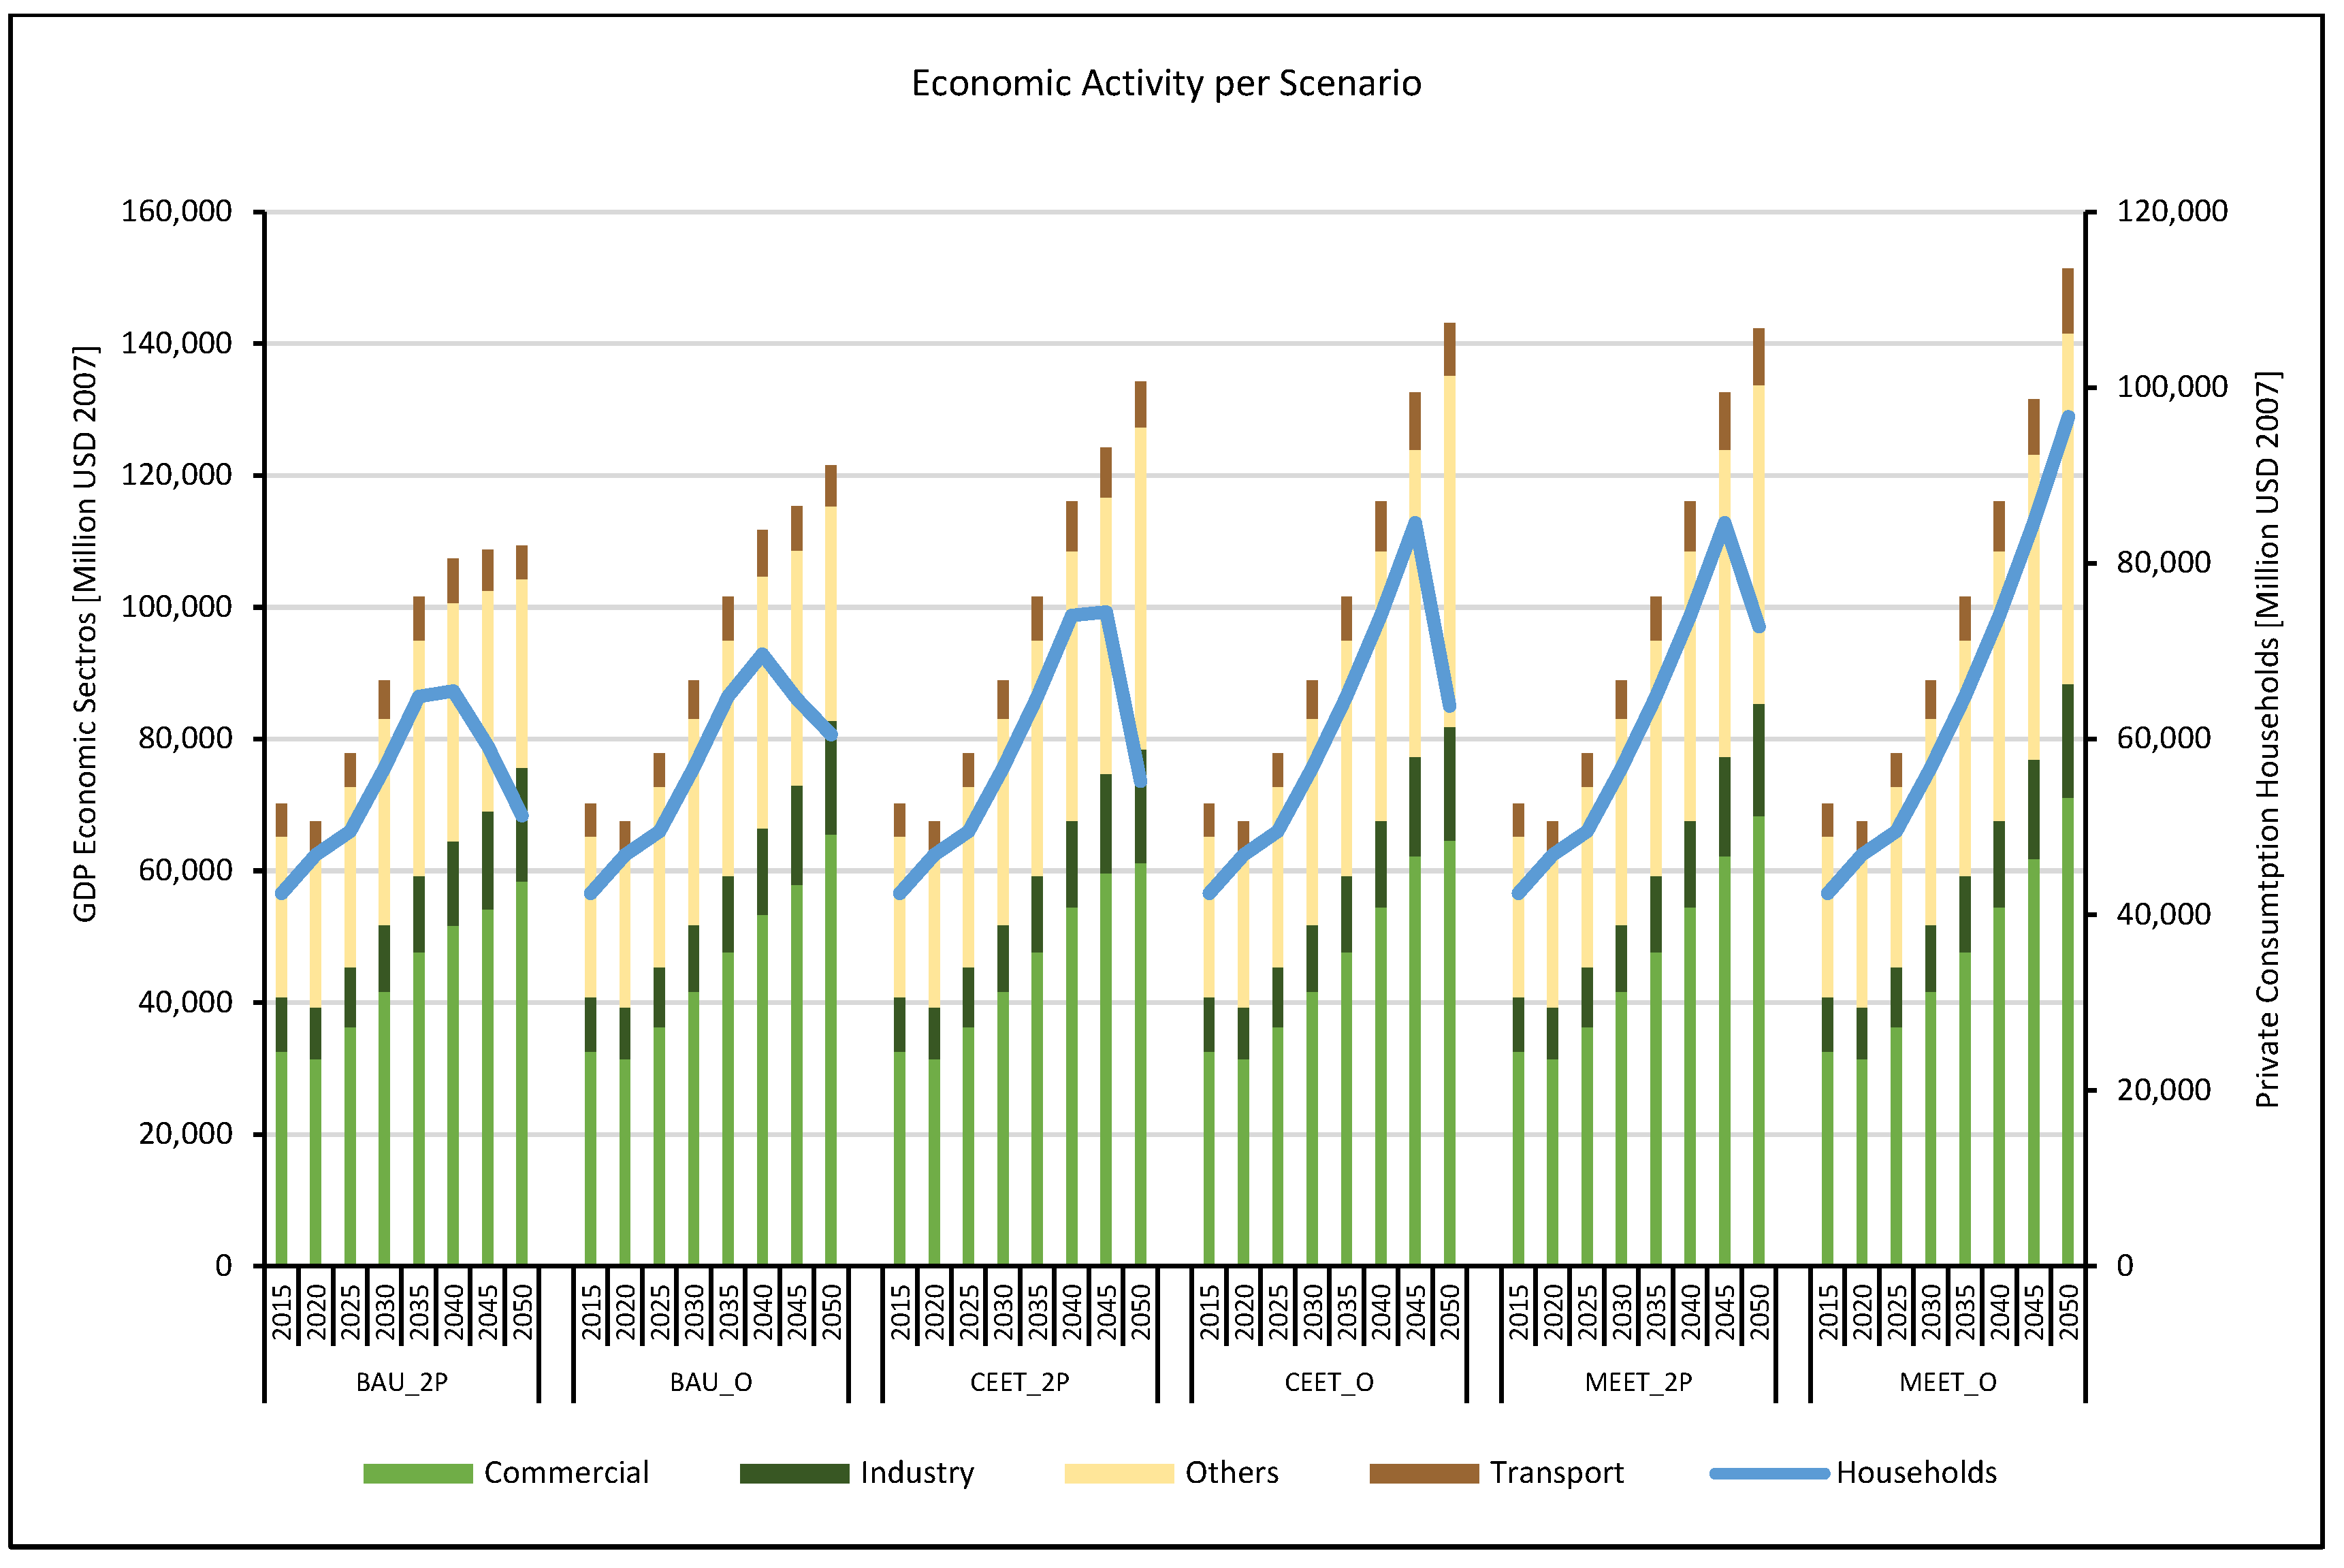
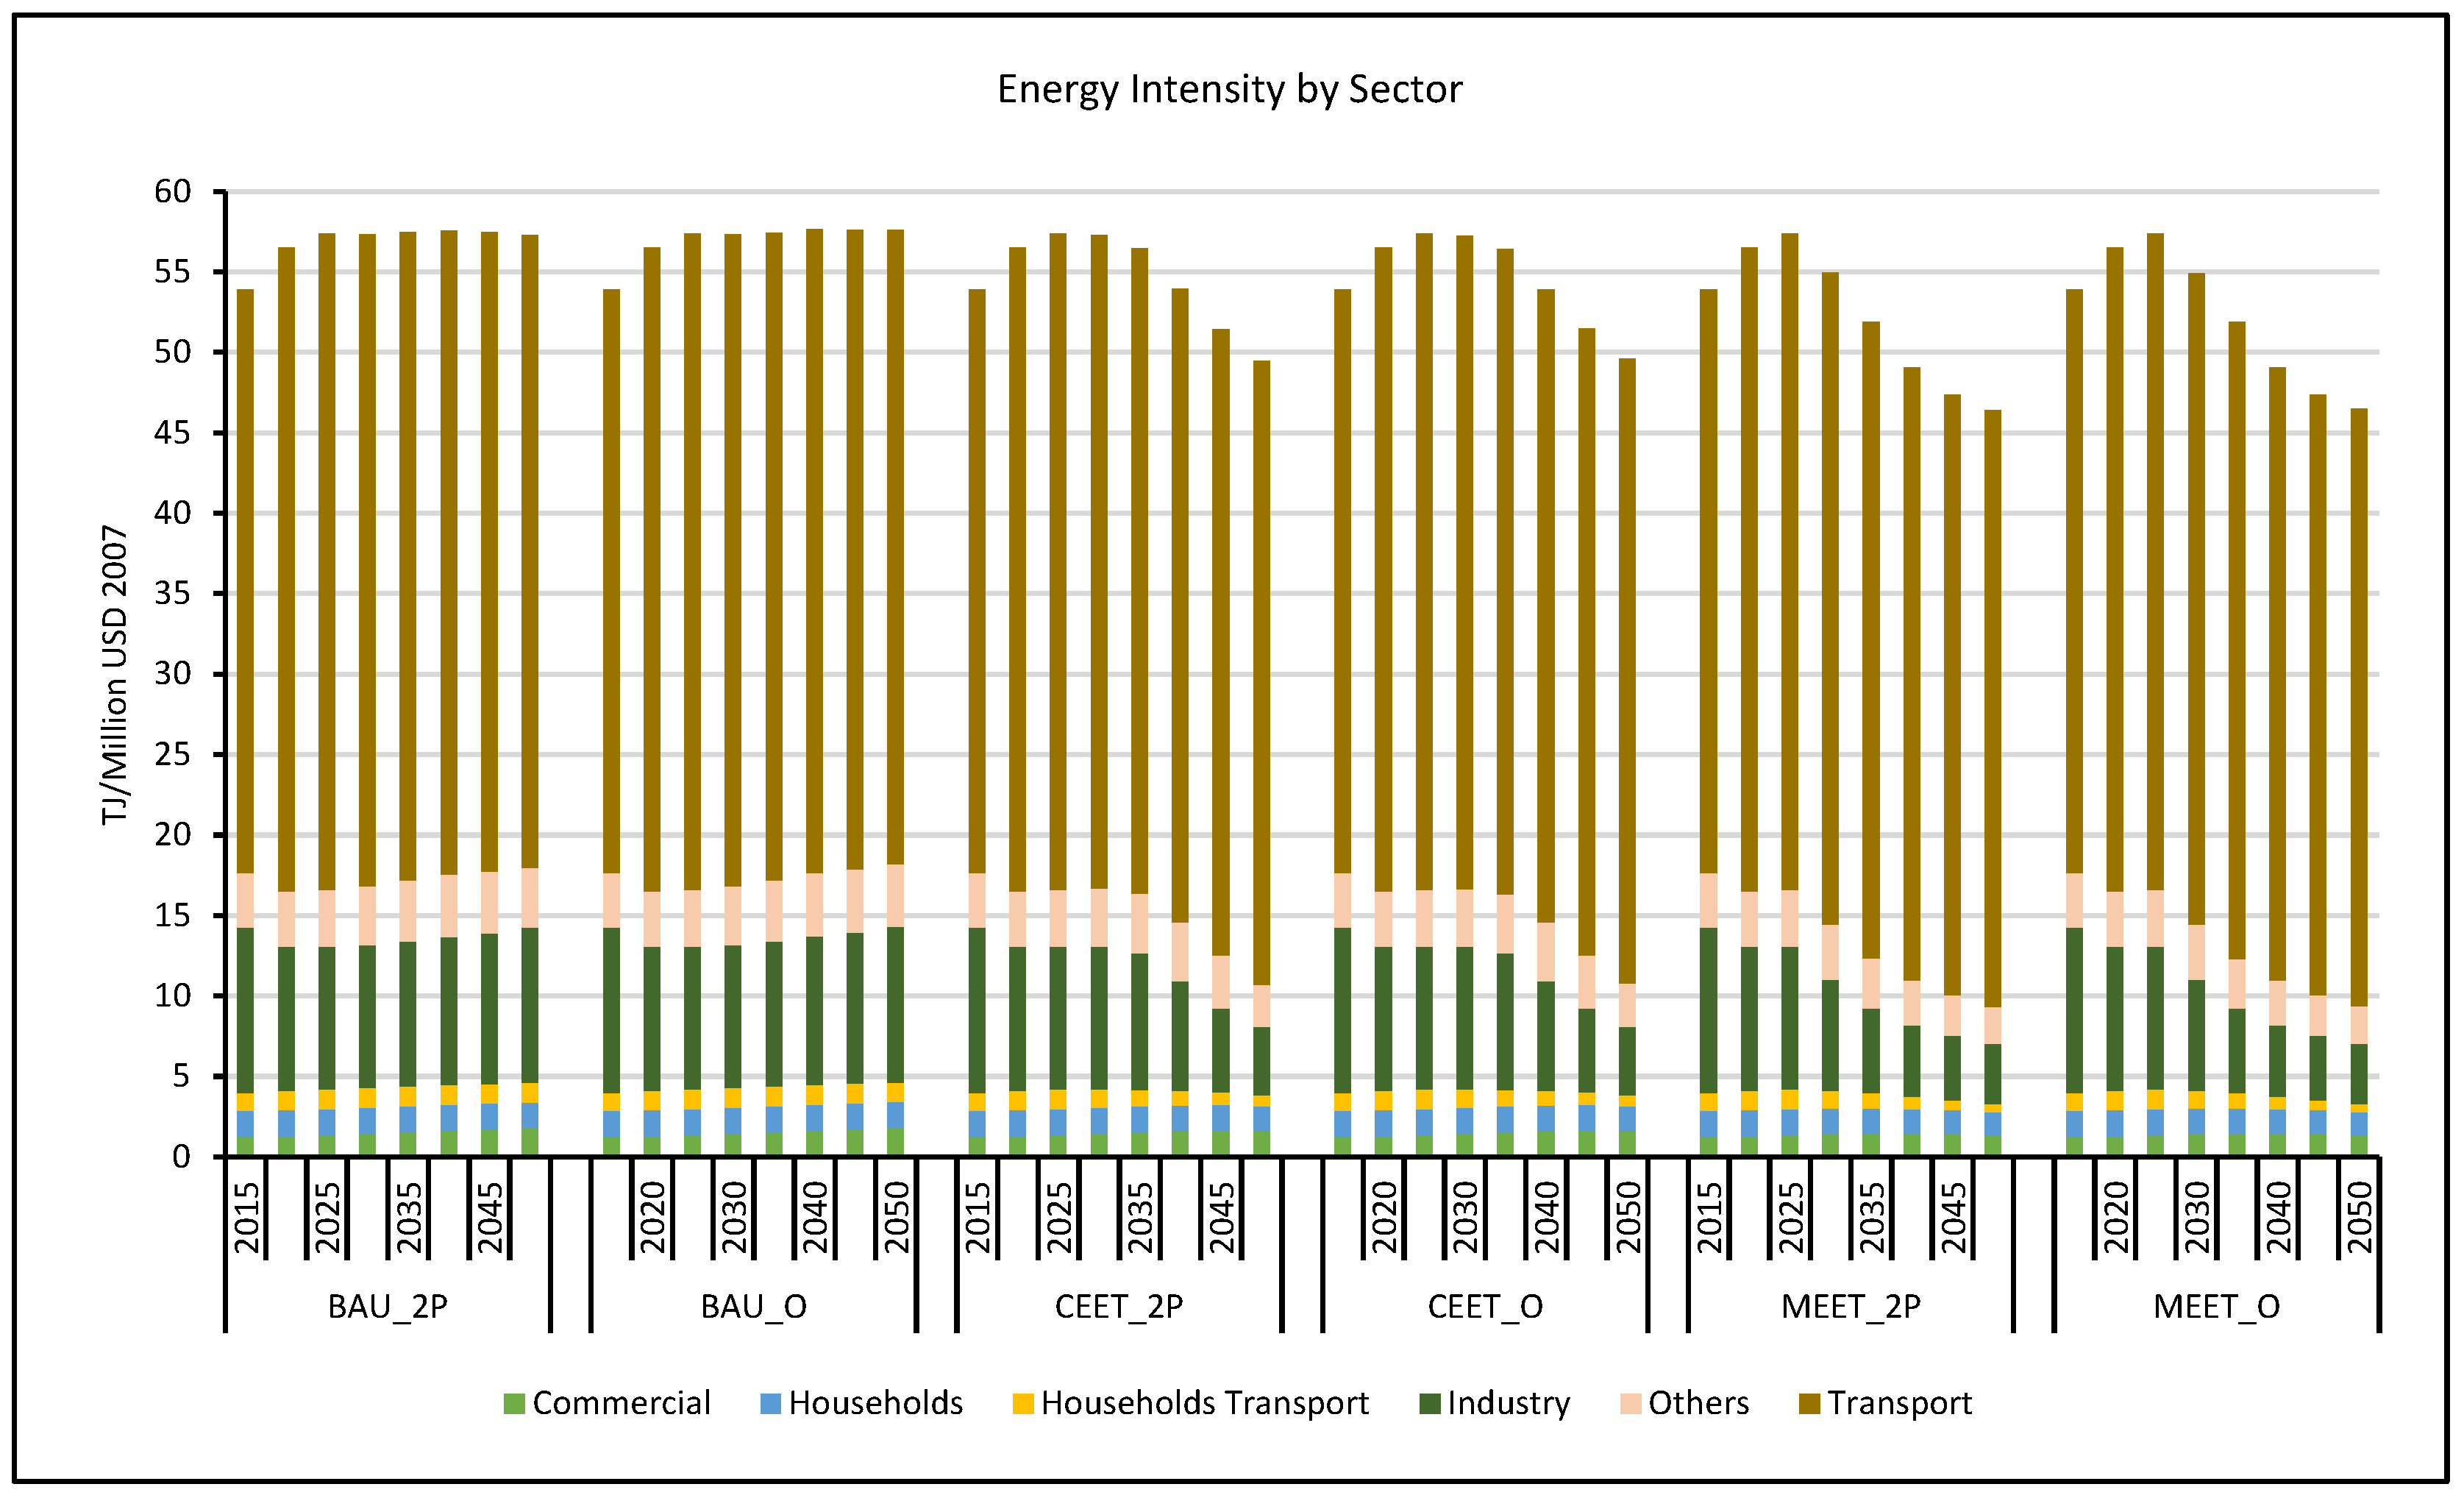
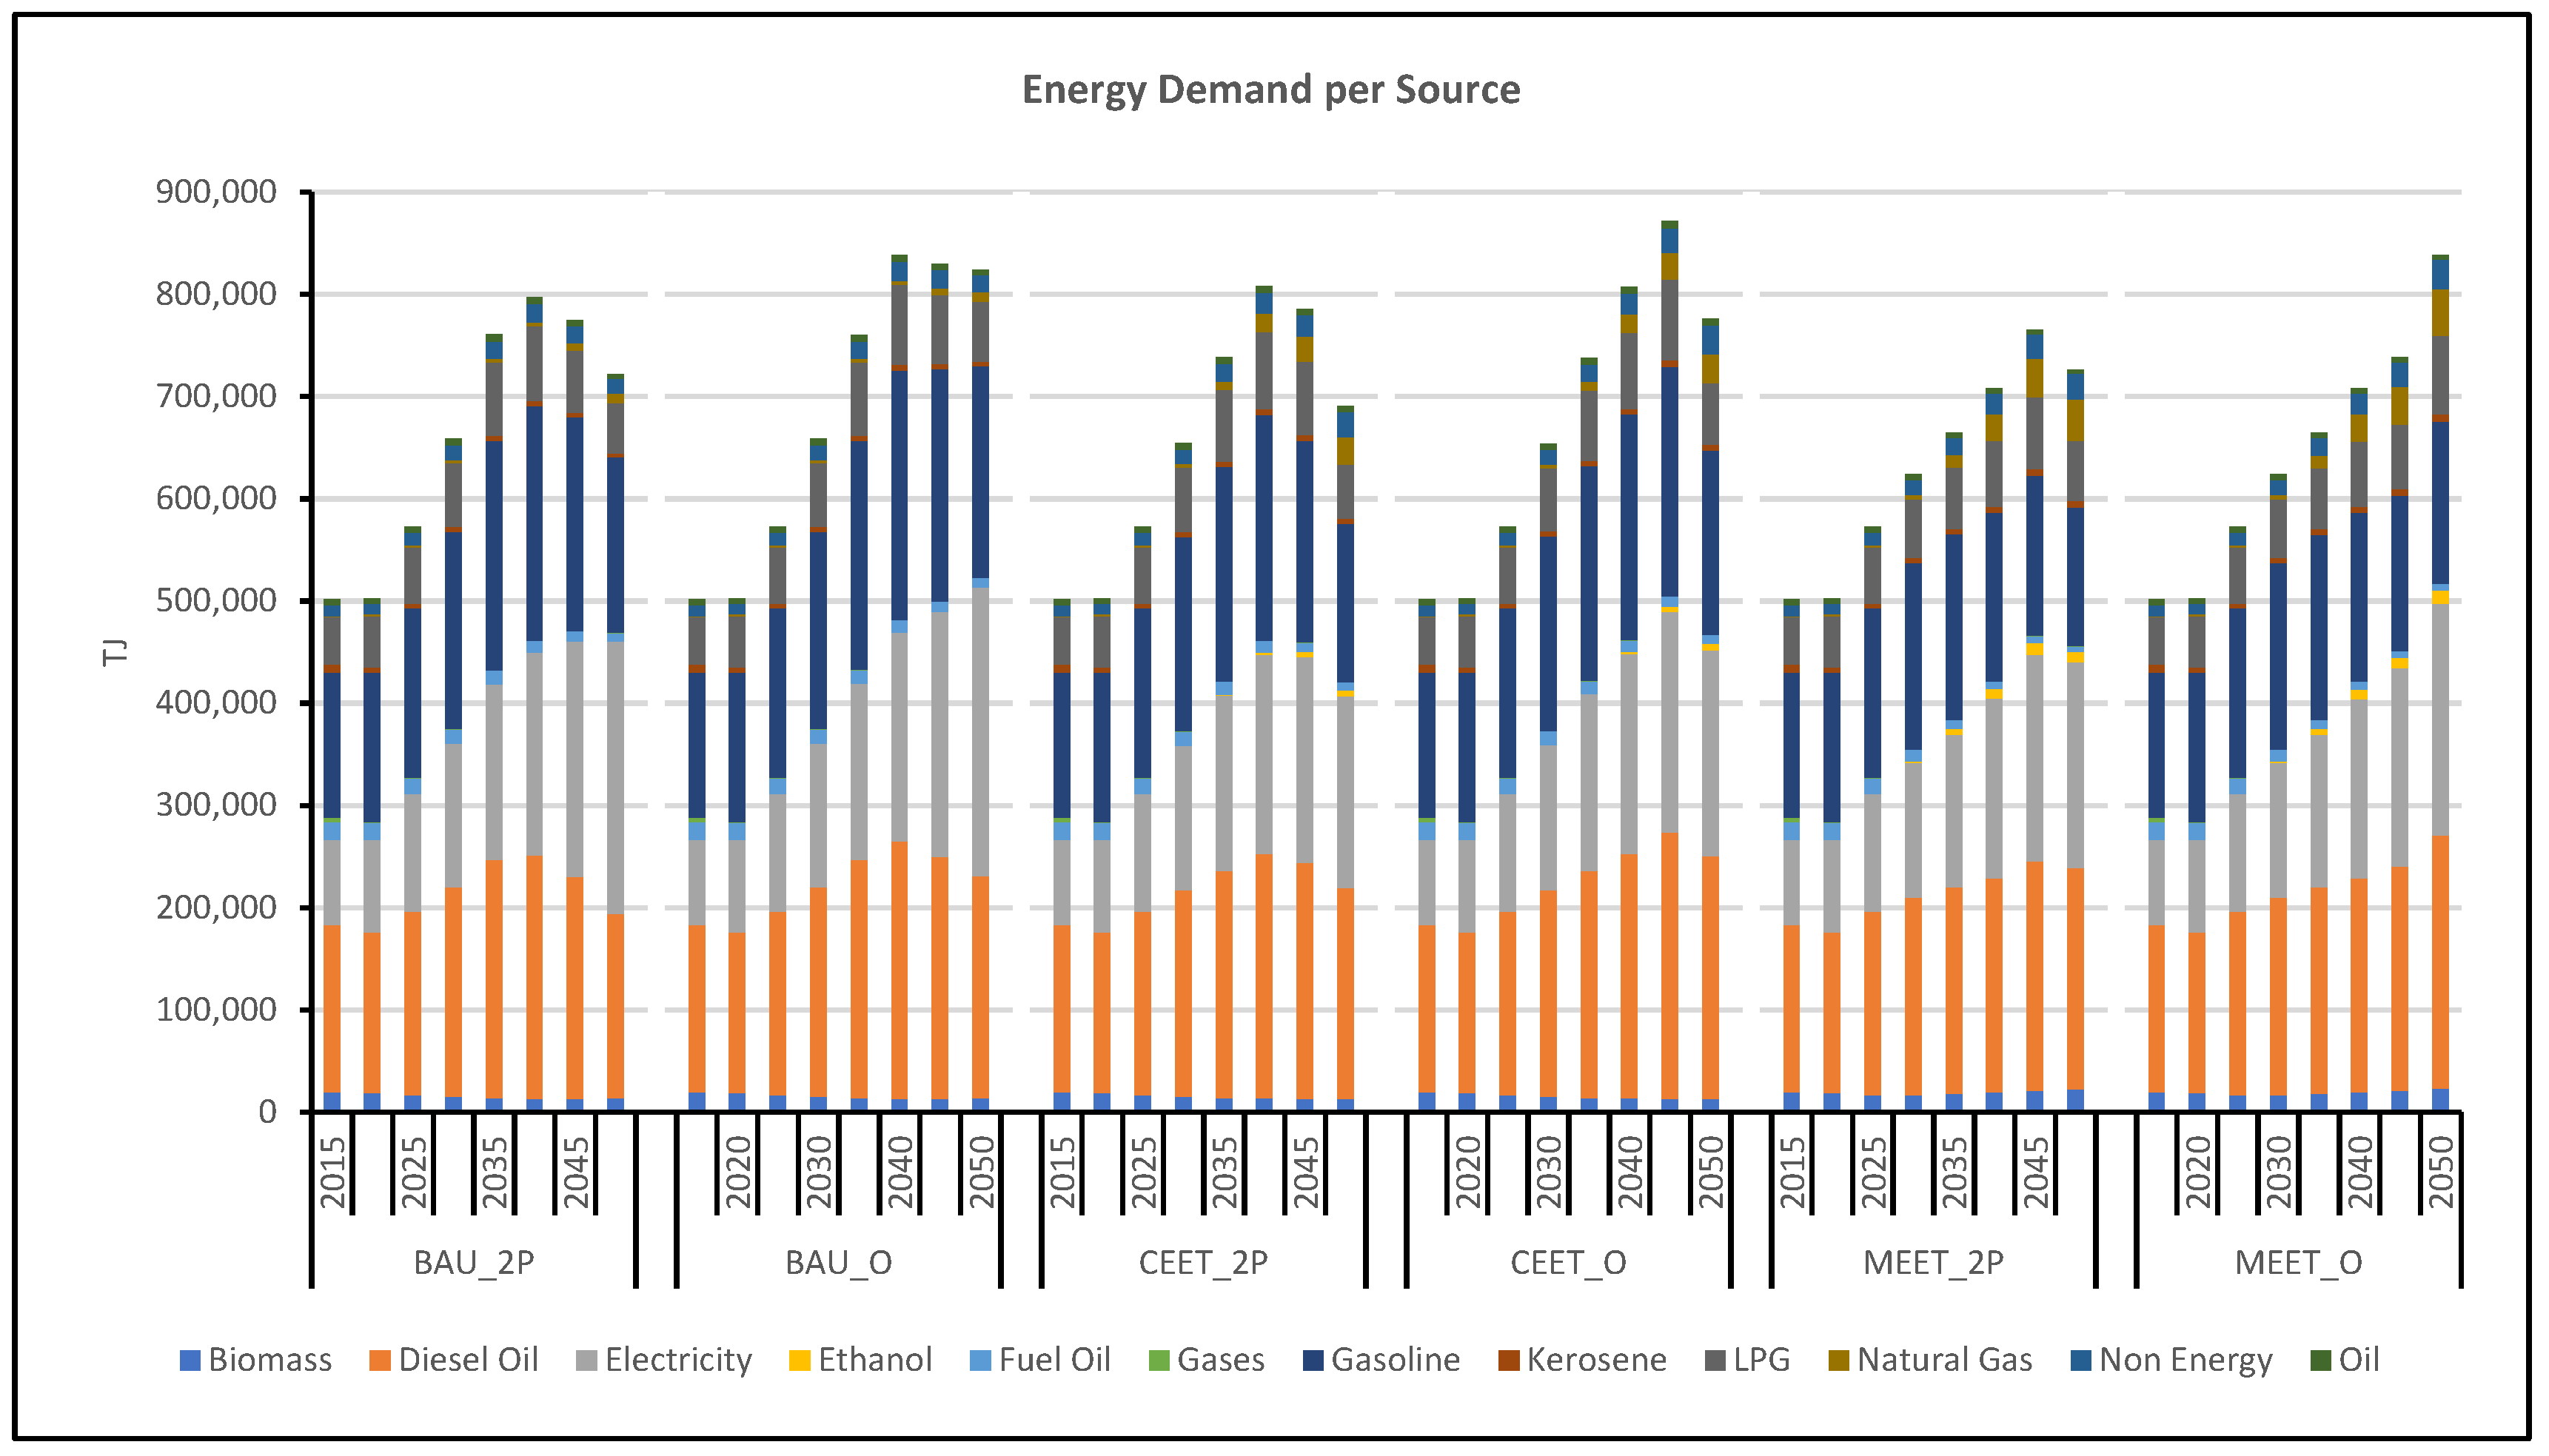
3.2. Energy Demand, Economic Activity, and Energy Intensity

Energy demand per sector for each scenario is depicted in Figure 4. For BAU scenarios, a peak on demand would be foreseeable by 2040 with a decay of 13% up to 2050 in BAU_2P, and 0.8% in BAU_O. This reduction in demand is attributed to deficits in energy supply that pressure the system to improve energy intensity to maximum limits, and, once they have been reached, a decrease in economic activity is inevitable (Figure 5). Demand in the BAU_O scenario by 2050 would be 14% higher than BAU_2P indicating the criticality of oil to meet energy requirements if current trends persist. From 2020 to 2050, the BAU_2P and BAU_O scenarios present a 44%, and 64% increment in final energy demand respectively and a 41% and 66% increase in GDP (Figure 5).
For CEET scenarios, energy demand would peak by 2040 in CEET_2P and 2045 in CEET_O as consequence of the decrease of the energy supply. Compared to BAU scenarios, energy demand by 2050 would be between 0.6% to 1.9% lower. However, economic activity would be 14%–18% higher (Figure 5), and energy intensity would reduce 13.7%–13.9% by 2050 in CEET scenarios (Figure 6). GDP would grow at an average yearly rate 2.3% for CEET_2P, and 2.5% for CEET_O. This indicates that even in a conservative case, the effects of the policies implemented towards energy transition would contribute to avoid economic collapse due to energy shortages.
Regarding MEET scenarios, energy demand would reach similar values to BAU scenarios (0.3–0.5% higher) by 2050, but economic activity would be 34% to 36% higher. A maximum effort towards energy efficiency improvement and reducing the use of fossil fuels would bring energy intensity values by 2050 to be 19–19.3% lower compared to BAU scenarios. Even in the MEET scenario, considering 2P oil reserves, an economic peak is reached in 2045 and degrowth afterwards. In addition, 2.7% economic growth estimations from [60] would only be feasible in MEET_O, with the strongest efforts for energy transition scenario and optimistic oil reserves.
Industry would register a share reduction in total demand by 2050 in all scenarios, from 20–23% in BAU, to 9–10% in CEET, and 8–9% in MEET. This sector has the largest energy intensity improvement among all with an average yearly rate of 3% for CEET scenarios and 3.5% for MEET scenarios due to aggressive policies implemented. Industry is the least affected sector in case of energy scarcity, given that economic activity would grow at average rates of 2.6% in all scenarios.
Regarding the commercial sector, its share in total demand would remain in values from 12% to 15%. Energy intensity would continue to increase in BAU and CEET scenarios, whereas in MEET scenarios, improvements of around 7% would be feasible by 2050 compared to 2020 values. This indicates that policies implemented in this sector are not capable to revert the inertial trend on the evolution of energy intensity. However, energy scarcity would not have a severe effect on the commercial sector’s economic activity. Scenarios depict with average growth rates of 2–2.7%.
Household’s sector including private transport would register the second largest share in all scenarios with values from 20% to 21% by 2050. Policies implemented in households transport would reduce energy intensity on an average yearly rate of 2.2% up to 2050. However, energy scarcity would cause Households private consumption to decay starting in 2038–2039 for BAU scenarios, and in 2041–2043 for CEET scenarios. MEET_2P scenario shows a downward trend starting in 2047, whereas in MEET_O, private consumption would steadily grow up to 2050.
In all scenarios, transport takes the largest share in total energy demand with values from 28% to 44% in 2050. Energy intensity shows a slight improvement in CEET and MEET scenarios with 3% and 7% reduction by 2050 compared to 2020 values. Regarding economic activity reduction due to energy scarcity, this sector would start a downward trend in 2038–2039 for BAU scenarios, 2041–2045 for CEET scenarios, and 2048 in MEET_2P scenario. In the case of MEET_O scenario, a steady growth is foreseeable.
The “Others” sector would have a share of 15–17% in total energy demand by 2050 depending on the scenario. Policies implemented would reduce energy intensity in 22–24% for CEET scenarios and 32–33% for MEET scenarios compared to BAU scenarios by 2050. Economic activity would tend to decay in BAU scenarios due to shortages in energy supply starting in 2038. For CEET and MEET scenarios, economic activity might continue to grow at average rates between 2.4% and 2.7%, which shows the effect that energy efficiency policies might have.
Transport, Households (due to the use of private vehicles), and “Others” would be the most affected sectors without ambitious policies for energy efficiency. In BAU scenarios, economic activity of these sectors would have the largest reductions. It is worth highlighting that these sectors are characterized a high dependency on petroleum products (above 70% of total sector demand).
Energy demand per source and scenario is depicted in Figure 7. In all scenarios, the main energy sources used are diesel (25–30% in total demand by 2050), electricity (27–37%), gasoline (19–25%), and LPG (7–9%). Diesel demand describes peaks in 2038 and 2039 for BAU_2P and BAU_O scenarios, respectively due to constraints on its national production and imports. Conservative efforts towards a transition would delay the effects of diesel constraints and demand would peak in 2040 for CEET_2P and 2045 for CEET_O. However, demand in CEET scenarios is higher than BAU given the increment in economic activity. Regarding MEET_2P scenario, diesel constraints will produce a peak in demand by 2048, and in the MEET_O demand would register maximum values by 2050. LPG demand in BAU, CEET and MEET scenarios depict peaks in the same years as diesel oil. Regarding gasoline, demand would be affected and peak in the same years as diesel oil in BAU and CEET scenarios. In MEET scenarios, gasoline (demand) would peak in 2032 which shows the effects of policies implemented, especially the introduction of alternative technologies for private vehicles (Households, Transport).
Compared to BAU scenarios, CEET and MEET depict an increment on the demand of natural gas (4–5% share by 2050), biomass (1.7–3%), and ethanol (1–1.6%). Natural gas demand increases given the policies implemented to substitute diesel in industry and transport (specifically in heavy duty vehicles), and LPG in industry. Regarding biomass, it is used to replace diesel and LPG in industry, and in the case of ethanol, it is used in transport to partially replace gasoline. Even in the most ambitious transition scenarios, fossil fuels would still play a key role with around 69% to 72% share in total demand by 2050. The most demanded petroleum products (diesel, gasoline, and LPG) would continue to be the most imported as well.

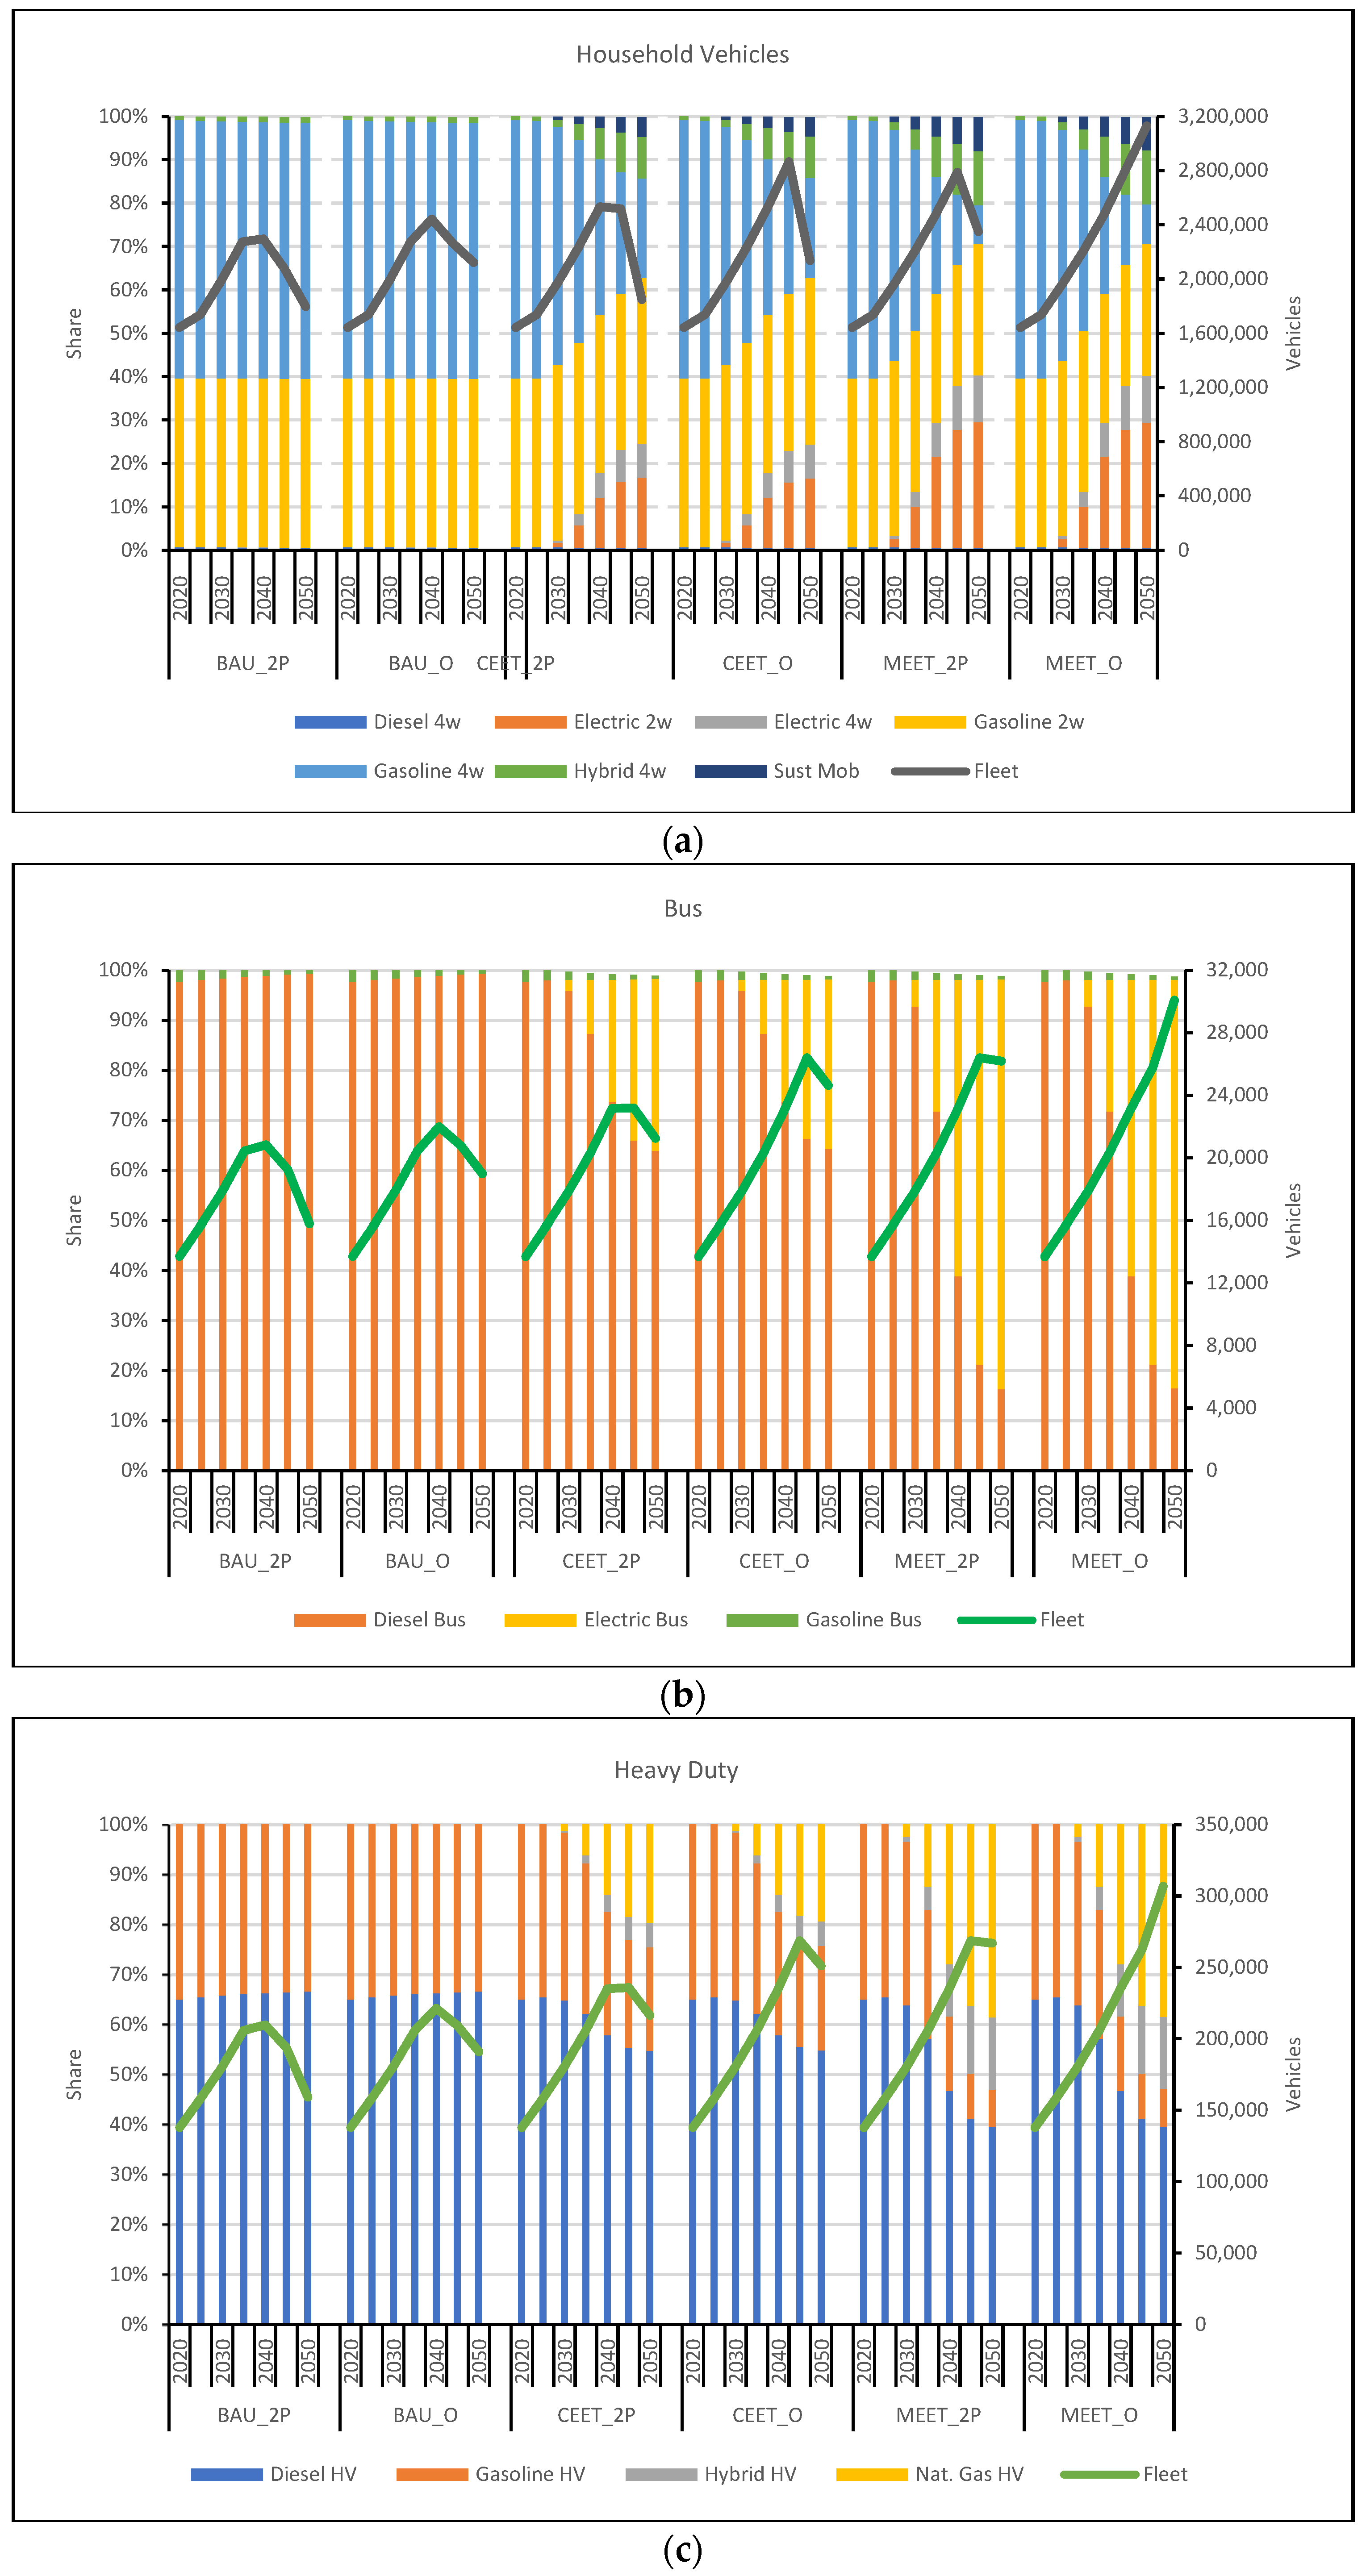
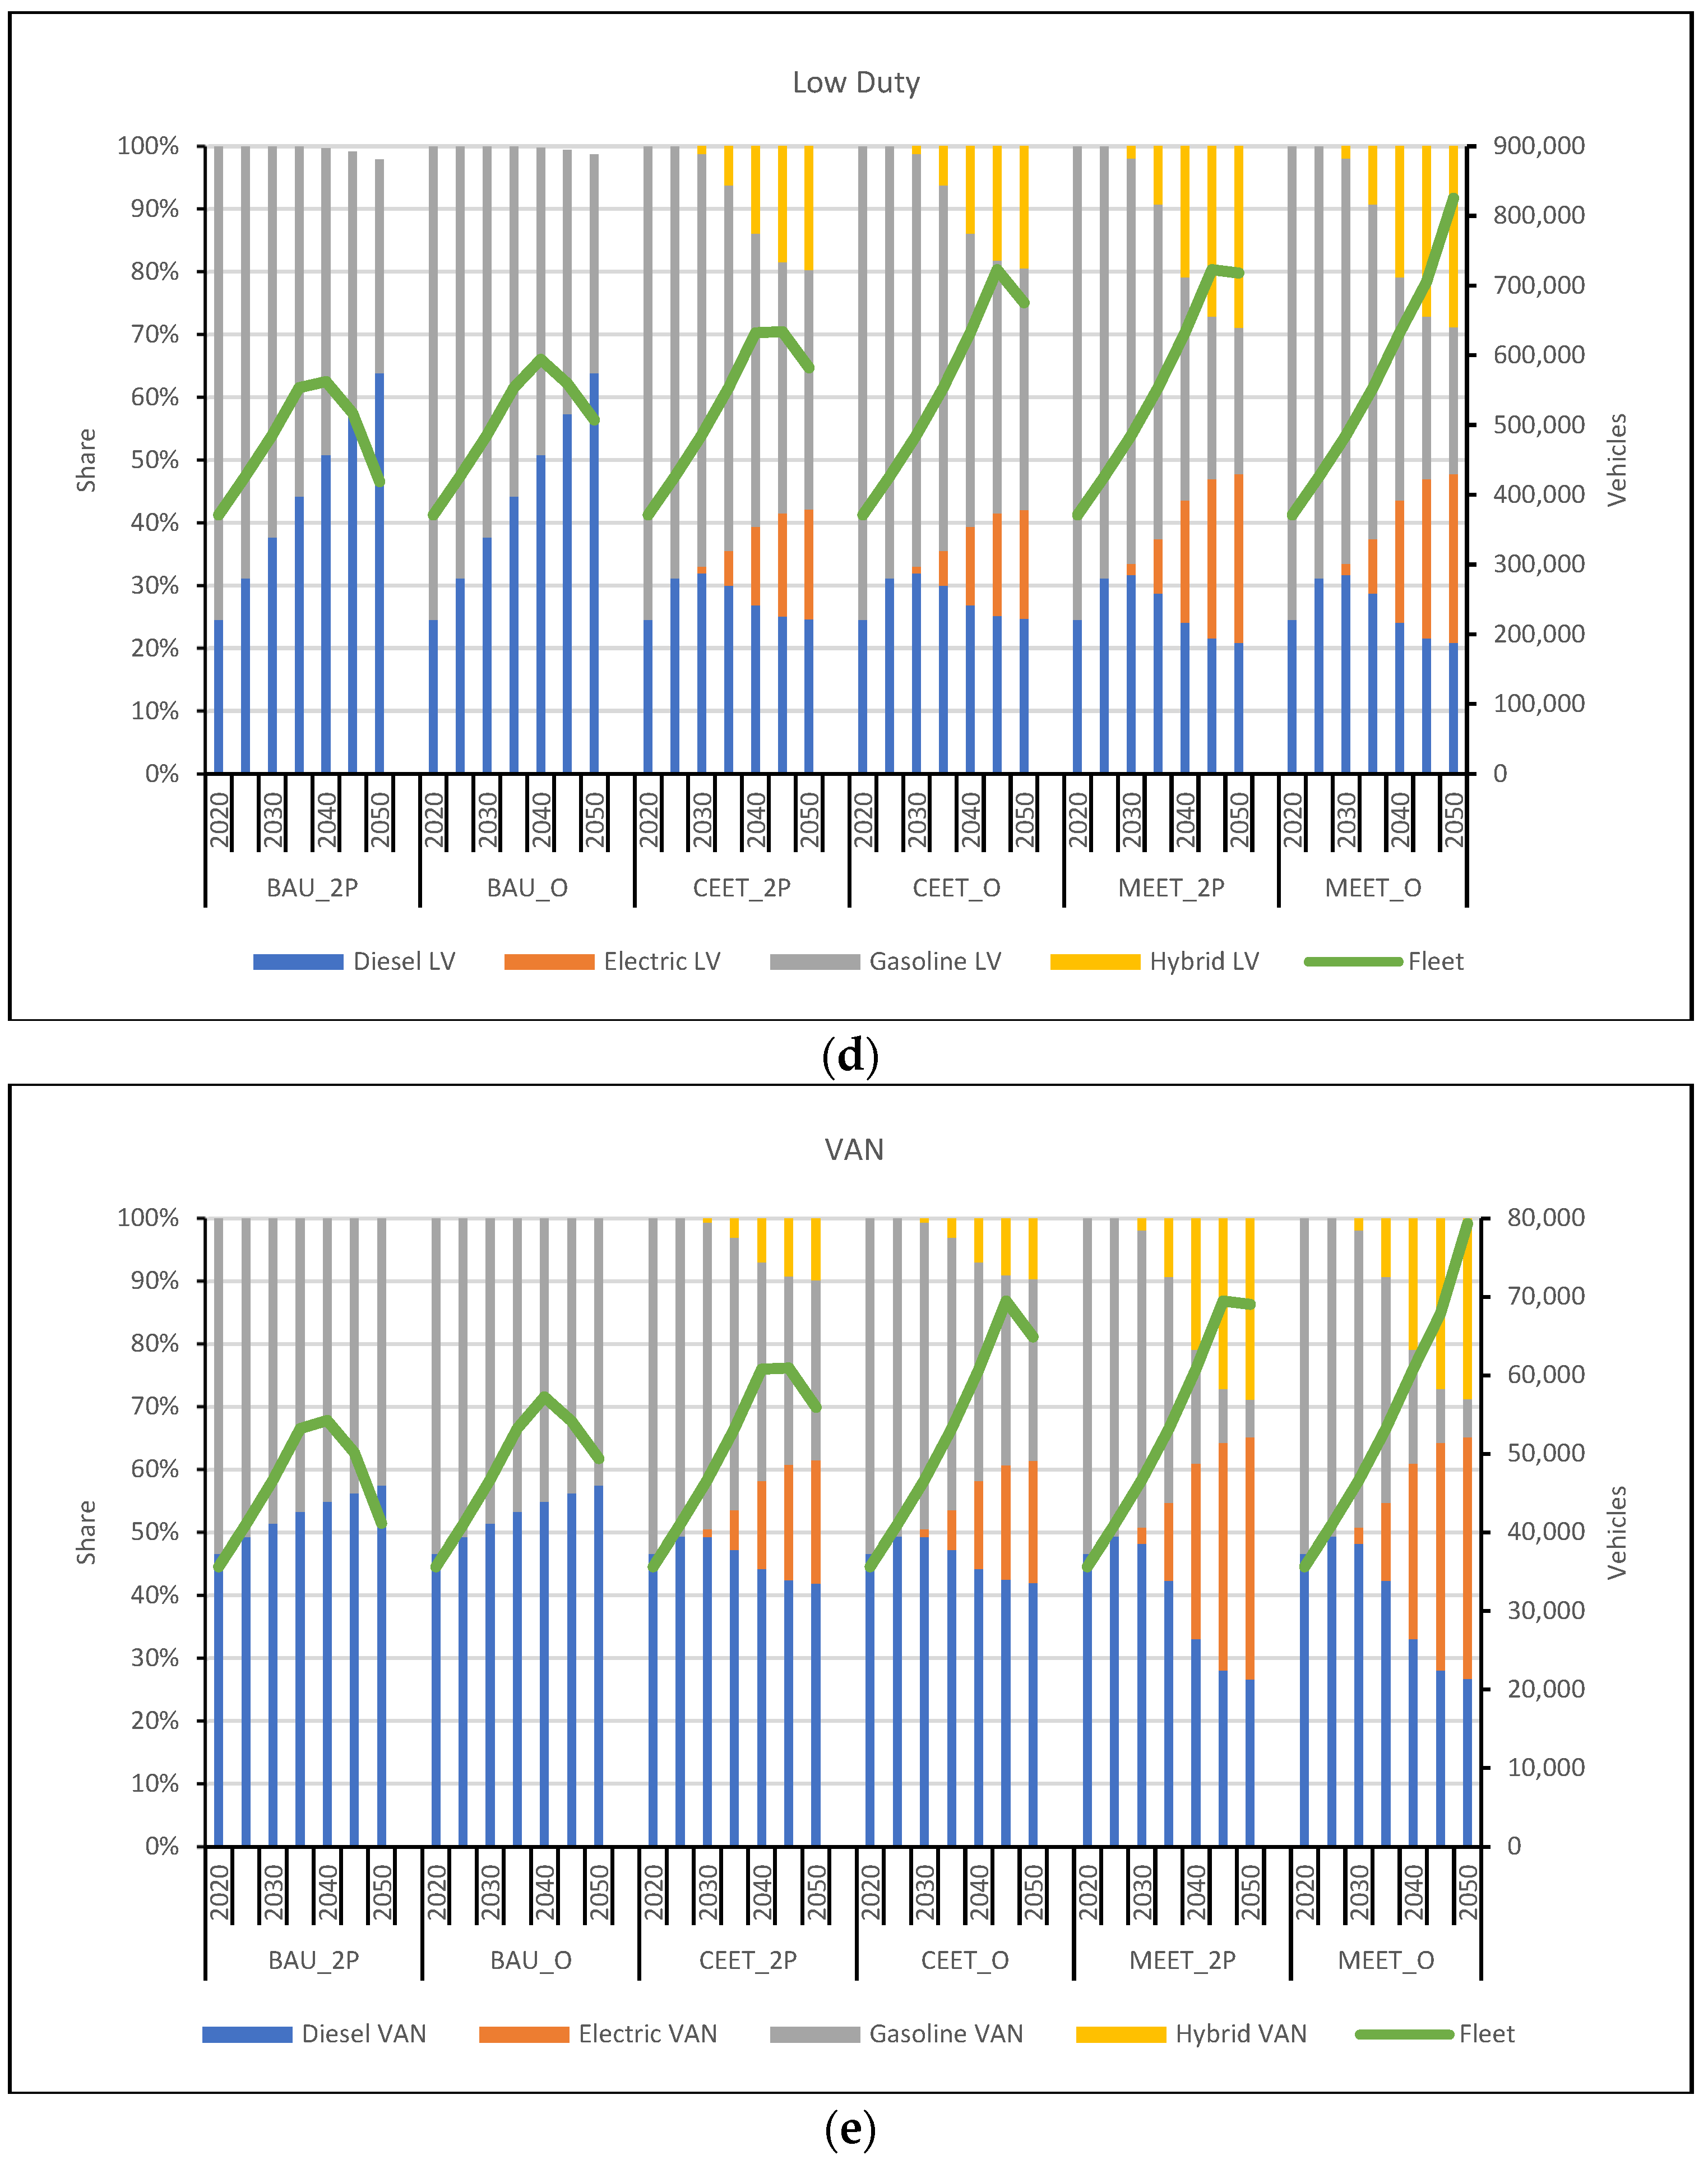
3.3. Transition in Transport Sector

In Figure 8a–e, the effects of policies developed for transport (households and commercial transport) are shown.
In the case of private vehicles, current trends in technology share indicate the predominance of gasoline four wheelers and two wheelers and the urgency to implement policies that would reduce the use of gasoline vehicles. In CEET scenarios with the increase of the share of two wheelers and the introduction of hybrid and electric technologies as well as sustainable mobility, gasoline four wheelers’ and two wheelers’ combined share would reach 61% by 2050. This would produce an improvement in energy intensity of 42% by 2050 compared to BAU scenarios. Regarding MEET scenarios, they describe a more ambitious strategy that would reduce the combined share of gasoline vehicles to 39% by 2050. It is worth noting the role of electric two wheelers (29%), hybrid and electric four wheelers (12.5% and 11%, respectively), and sustainable mobility (8%) in reducing energy intensity of private transport in 59% by 2050 compared to BAU.
Commercial road transport depicts concerning trends under BAU scenarios for all vehicle types, given that diesel vehicles would remain the most used technology, facing potential shortages due to the reduction of petroleum products’ supply starting in 2038. CEET scenarios show a panorama with a slight introduction of alternative technologies in all vehicle types. Even though the considerable increase in the share of hybrid and electric technologies in categories such as Buses, Low Duty, or VAN (between 30% and 40% by 2050), energy intensity by 2050 is only 2% lower compared to BAU (Figure 6). This indicates that Heavy Duty vehicle is the category that takes the largest share in terms of energy intensity and energy demand in the transport sector. Policies implemented in this category have considered the introduction of hybrid and natural gas vehicles in detriment of diesel vehicles.
MEET scenarios depict an important change in the technology mix among all vehicle categories, especially for buses (80–81% electric by 2050), low duty (29% hybrid and 27% electric), and VANs (29% hybrid and 39% electric). Nevertheless, energy intensity by 2050 would only be 6% lower than BAU scenarios given that Heavy Duty vehicles still have a large share of technologies that are less efficient compared to hybrid (Diesel 40%, and Natural Gas 39%). Even the most ambitious scenario towards an energy transition in this sector does not have a profound effect due to limitations imposed by the national context. Regarding total fleet in all transport types, BAU scenarios, CEET scenarios, and MEET_2P scenarios show a downward trend due energy scarcity and its consequent reduction of economic activity as depicted Figure 3.

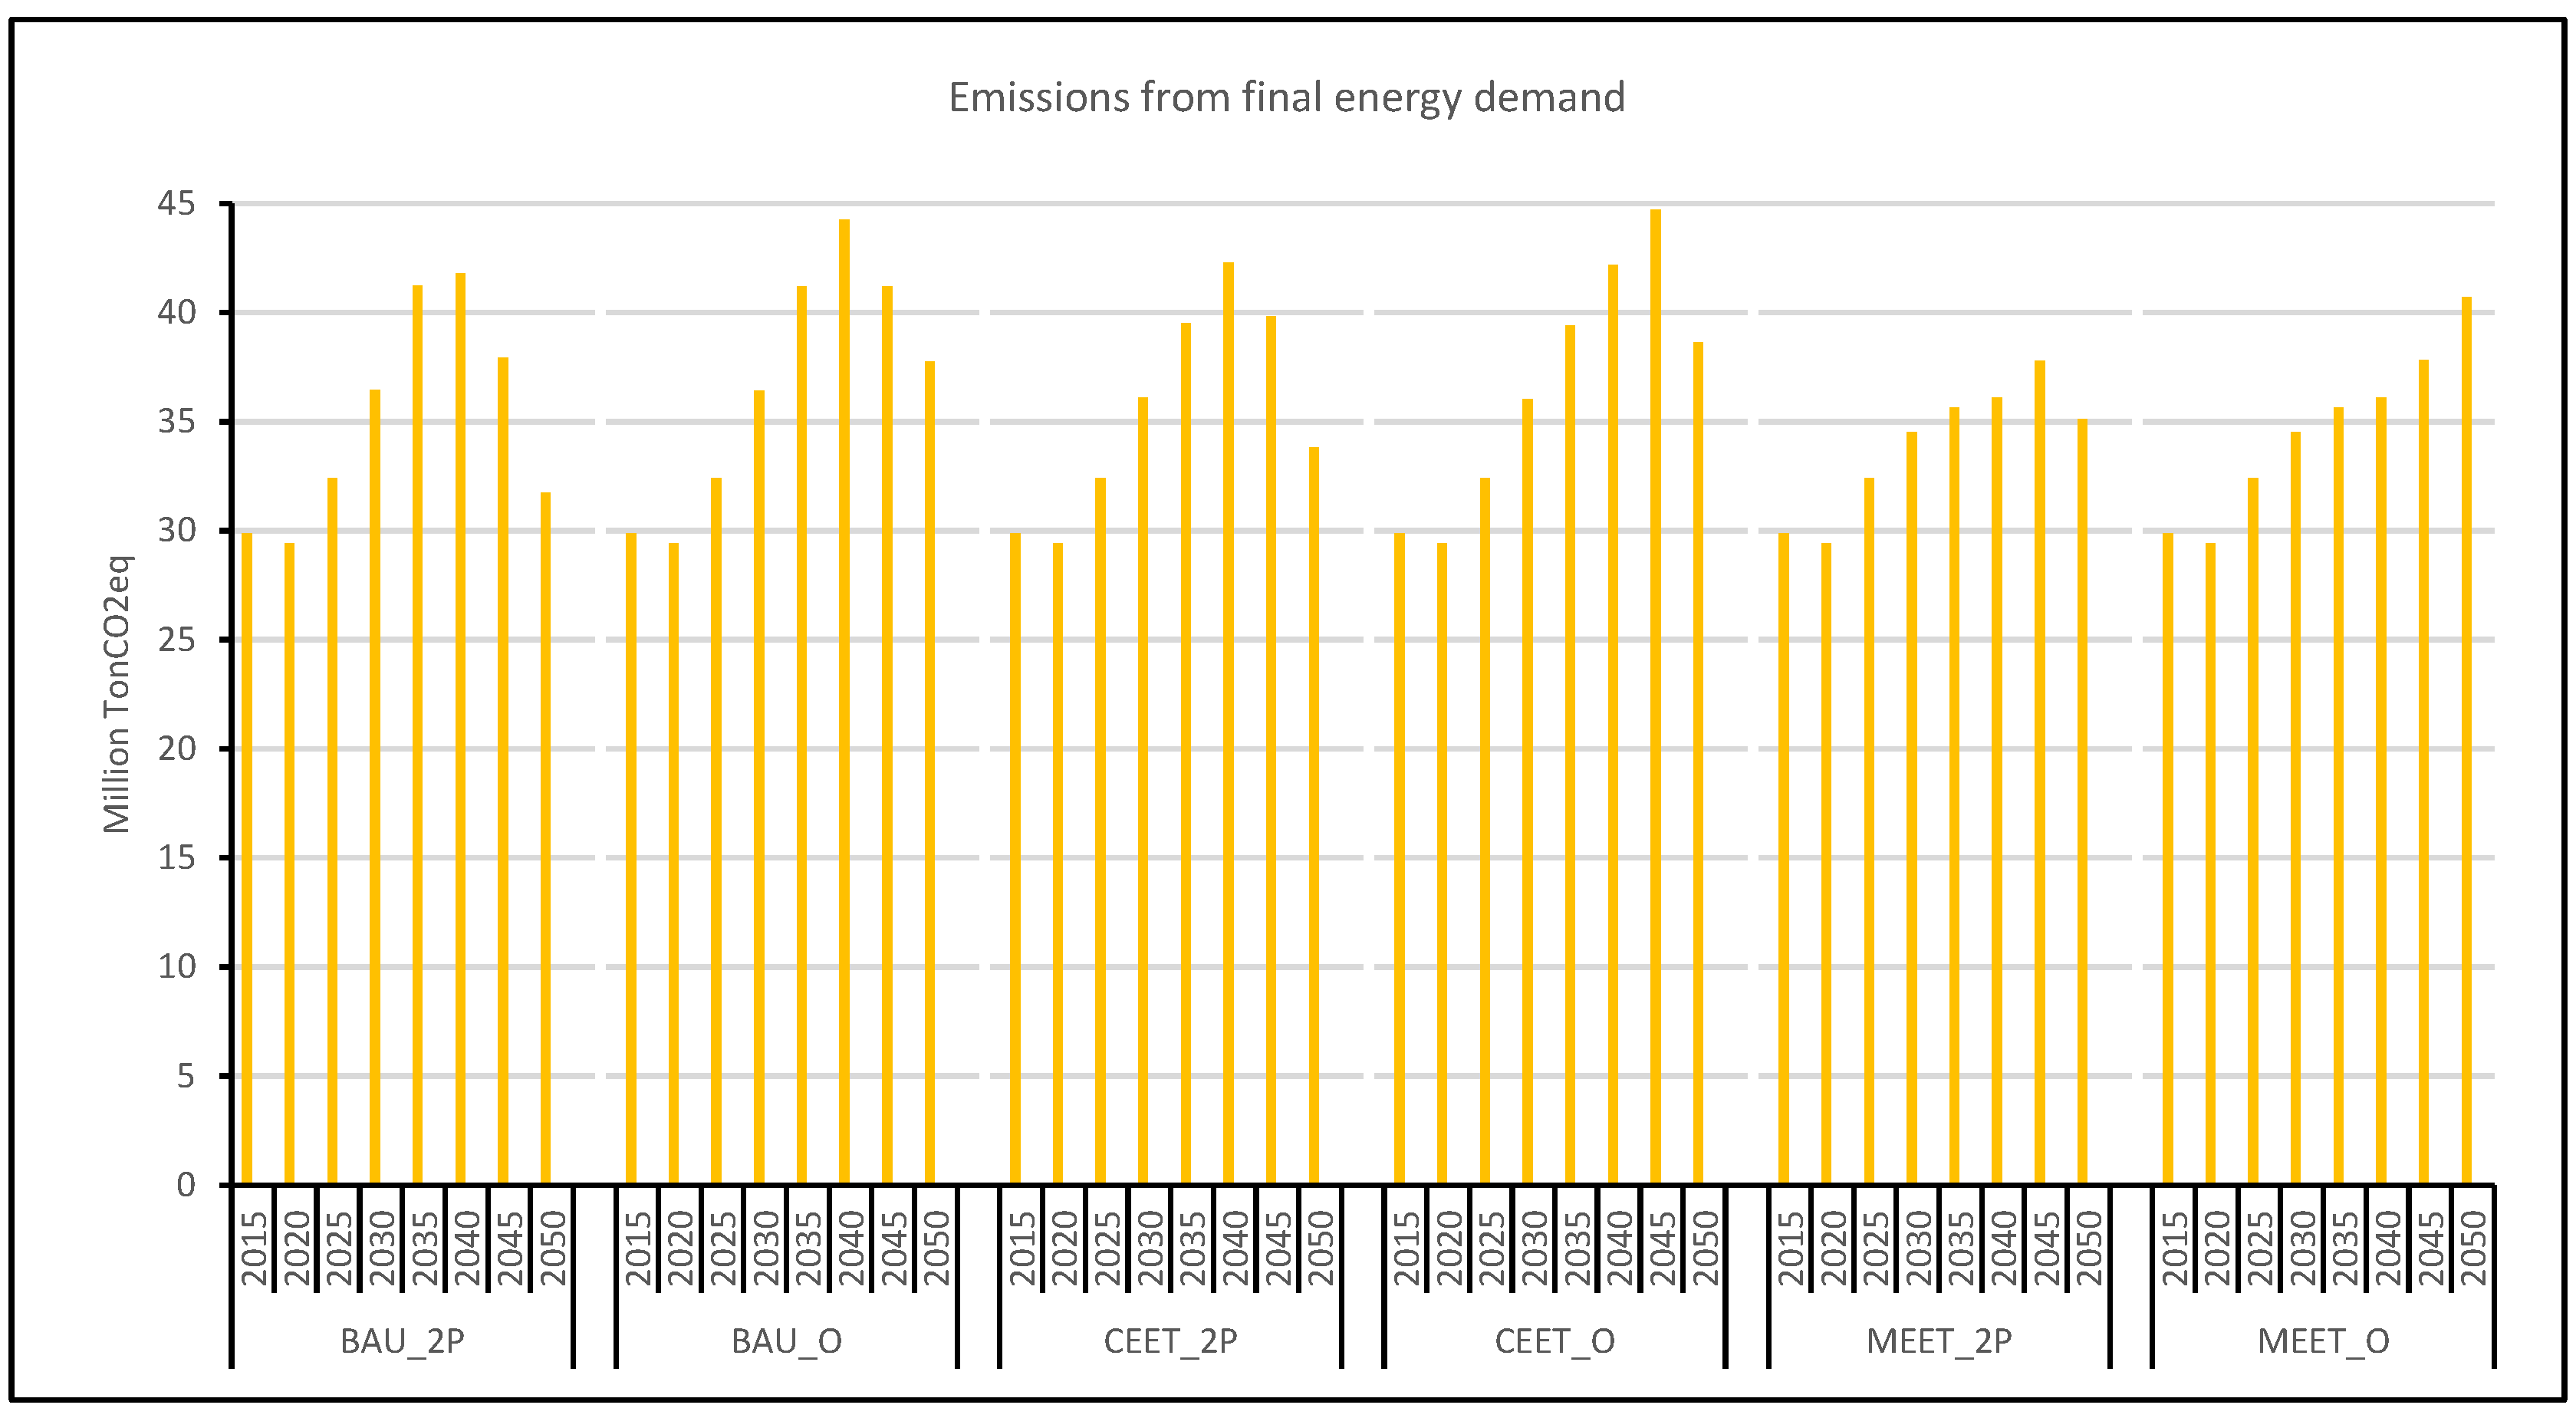
3.4. Emissions and Indicators

Greenhouse gas (GHG) emissions from final demand evolve differently depending on the scenario (Figure 9). A considerable reduction of GHG emissions would occur in BAU scenarios due to GDP decay caused by energy scarcity. By 2050, emissions in BAU_2P would reach 2024 values, whereas in BAU_O it will reach 2031 values. Emissions for the CEET_2P and CEET_O scenarios would peak in 2040 and 2045, respectively. Values by 2050 would be 7% and 2% higher compared to their corresponding BAU scenarios, due to a higher economic activity.
In the MEET_2P scenario, the evolution of GHG emissions present a moderate slope that peaks around 2046, reaching by 2050, values 11% higher compared to BAU_2P. In the case of the MEET_O scenario, a higher economic activity fostered by a larger availability of national oil would result in emissions 8% higher than BAU_O by 2050. However, this scenario is the only one where sustained economic growth would be feasible.
Table 3 compares the trajectory that GDP per capita and final energy consumption per capita (GDPpc) might have for Ecuador under scenarios analyzed versus the world under a BAU trend taken from the MEDEAS model [23].
For the timeframe analyzed, even though there is a trend that reduces the difference between national and global values for transition scenarios, by 2050, GDPpc for Ecuador would still be 43–35% lower than world levels. Likewise, Total Final Energy Consumption per capita (TFECpc) for Ecuador would be 20–26% lower than world values reported by [23]. This means that Ecuador would still have the opportunity of a higher economic growth. Nevertheless, a more optimistic economic scenario would require an even more disruptive scenario than MEET with more ambitious strategies. It is worth assessing how big the difference would be under a global scenario towards energy transition.
Table 4 shows the evolution of energy transition indicators for each scenario. To analyze the outcome of policies implemented, a comparison with global perspectives has been done using as a reference, the analysis performed by the IEA for 2040 [56] and 2050 [75].
Regarding Final Energy Carbon Intensity, BAU scenarios show a decay mainly attributed to the reduction in energy demand caused by scarcity of oil and petroleum products. CEET scenarios might surpass the expected global goal up to 2040 under stated policies but is not enough to cope with the goal under the sustainable development scenario. MEET scenarios would exceed the stated policies goal as well, but it will not meet the sustainable development goal.
The Power Carbon Intensity indicator depicts the results of the efforts that Ecuador has undertaken to foster the use of renewables for electricity generation. BAU scenarios show that by 2050, they will reach lower values of emissions compared to the global goal under stated policies. However, it is far from reaching the global goal under a sustainable development scenario. CEET scenarios present a considerable reduction of emissions per unit of electricity (less than half the value of BAU scenarios by 2050). Nevertheless, they are around five times larger than the expected goal of the sustainable development scenario. In the case of the most ambitious scenarios, emissions per GWh by 2050 in MEET_2P would be around 63% the value estimated for MEET_O. Once again, even the maximum effort for energy transition considered in this research would not be sufficient to keep up with global targets in a sustainable development scenario.
Electricity share in final demand in BAU scenarios depict values that are close to global targets under stated policies by 2040. In 2050, values are close to global targets expected by 2040 in a sustainable development scenario. However, this behavior is related to the reduction in demand due to scarce petroleum products and not to any substitution policy implemented. In the case of CEET and MEET scenarios, they present similar trends as in BAU scenarios for the period 2040–2045. By 2050, these scenarios might reach the global target of stated policies scenarios expected for 2040.

4. Discussion

BAU scenarios indicate that currents trends of the Ecuadorian energy system might lead to a complicated future for fossil fuel rich developing countries. A profound energy crisis would be foreseeable due to the depletion of national oil reserves and the restricted access to imports. In the Ecuadorian case, that crisis would start in 2040. Even the most optimistic case of national oil availability might only make the decay less severe, and a forced-not planned transition would happen. The energy mix in final demand would still be dominated by petroleum products whose production might be reduced due to restrictions access to oil, and imports. Continuing the dependency on oil and petroleum products under a limited availability of these fuels at the national and global level might generate energy shortages and a contraction of economic activity (average growth of 1.8% per year compared to 2.7% expected), affecting mostly those sectors that have predominance of petroleum products in their consumption mix. As it has been seen, commercial transport, “others,” and private transport (households) would experience the largest reduction in economic production.
Conservative efforts towards an energy transition might partially revert BAU trends mostly in “Others”, transport households, and industry. These sectors would reduce their energy intensities in 20%, 40%, and 50%, respectively in the next thirty years due to the energy efficiency measures and source substitution. These policies will be supported on a planned expansion of power capacity with a share of renewables of above 90%. Nevertheless, the largest energy consumer (Commercial Road Transport) would only reach a 3% reduction of energy intensity in three decades. Economic average growth (2.4% per year) would still be below expected values.
The most ambitious scenarios for an energy transition might have a diverting effect on the future trajectory of the fossil fuel rich developing countries, that in the Ecuadorian energy system, would allow an average expected economic growth of 2.7% per year until 2050. However, there would still be a predominance of fossil fuels specially on heavy duty vehicles, which is the most energy demanding segment within commercial road transport. Even though policies implemented show a reduction in the use of diesel oil due to the introduction of natural gas and the introduction of hybrid trucks, these measures combined with the ones in other segments (Low Duty, Buses, and VANs) would only reduce energy intensity by 7% in the next thirty years. Therefore, significant efforts are needed for a profound transformation of this sector. Even if natural gas in heavy duty vehicles could be an important strategy, it must be considered as a transition technology due to its certain depletion in the future. National Natural Gas reserves are limited, and they would not be able to meet an increasing demand for electricity generation and final use in sectors such as industry and transport. It is worth considering that developing of infrastructures for transport and distribution would require important investments. Moreover, there could be systematic and unique risks associated to its supply that should be assessed [76].
Regarding the impact of oil availability on fossil fuel rich developing countries energy transition, it is worth noting that in all scenarios described for the Ecuadorian case (BAU, CEET, and MEET) as the system has more oil, it tends to ease the pressure to substitute fossil fuels with other, more available sources (mainly electricity that will increase its share of NRE as well). Even though counting on all the oil available to date would certainly be a key in the energy transition process and sustaining economic growth as MEET_O scenario depicts, it is most likely that oil extraction might not reach this bound.
Energy transition indicators depict the remarkable progress in terms of final energy carbon intensity and electricity share in the final demand up to 2030 based on the ambitious national plans for power capacity expansion supported by hydro, solar PV, and wind. From this point forward, although the country might surpass the estimated world reduction rate under Stated Policies scenario by 2050, it would be far below the global average proposed by [75]. In this sense, considering the vast remaining potential of renewables, its deployment should speed up to avoid the expected increase in the share of fossil fuels for electricity generation. Moreover, a more intensive use of biomass with carbon capture and storage could be considered. The potential introduction of these technologies has been analyzed by [38], highlighting its relevance for deep decarbonization of electricity generation, but its feasibility in the Ecuadorian context and at global level is still an issue to consider.
It is clear then that oil would still play a key role in future energy landscapes in Ecuador if a moderate-sustained economic growth is desirable up to 2050. A similar conclusion can be made for other fossil fuel rich developing countries. Its criticality, as energy and income source have shown in all scenarios proposed, that even the most aggressive an feasible strategies towards an energy transition would not be enough to cut its dependency. In the case of Ecuador, mining has been considered an interesting alternative to replace oil as income source. During the past two years, the mining sector has gained momentum and it is expected that exports would increase by 40% in 2022 compared to the previous year [77].
The EEDEC model simulation has considered scenarios with the most feasible strategies and technologies for the Ecuadorian context that are representative for other fossil fuel rich developing countries. However, the dynamic structure of the model allows the addition of new technologies for direct use of energy. One alternative to be considered is solar thermal given the potentiality studied by [78]. Other technologies to include could be hydrogen for transport, freight train, and nuclear energy. Nevertheless, the feasibility of these alternatives should be analyzed considering the Ecuadorian context. Another point to develop is the effect in the economy of restricting oil exports given its importance as an income source for the national budget. For this purpose, a more detailed economic model with the use of input-output tables could be developed and linked to EEDEC. However, the development of such a model is out of the scope of this work. Furthermore, besides indicators used to assess energy transition, energy security performance for these and future proposed scenarios should be assessed using available methodologies [79,80,81,82,83,84]. Finally, it is worth developing a more detailed structure regarding energy demand and final energy use. Nevertheless, more disaggregated information is needed.

5. Conclusions

Energy transition is an unavoidable process that every nation would have to face in the short or medium term. Moving from a traditional energy system to a more diversified, and sustainable one could be a difficult endeavor for developing countries. Ecuador, as a developing and oil producing country, might have to handle a future without an ever-decreasing dependency on this source for energy and income without compromising its economic growth. Ecuador Energy Development under the Energy Constraints (EEDEC) model was developed to assess the possible pathways that a fossil fuel rich developing country as Ecuador could have considering current trends, and alternative scenarios towards an energy transition based on biophysical limits at national and global level.
This work presented scenarios simulated in the EEDEC model with a business as usual (BAU) narrative, and conservative (CEET) and maximum (MEET) efforts towards energy transition considering two cases of national oil availability (2P and O). BAU scenarios indicate that current trends for energy demand are not compatible with an energy transition process given that oil, would still take the largest share in the consumption mix, especially in the energy intensive sector transport. Energy scarcity would start by 2040 and it would provoke a downfall in projected economic activity, especially in sectors with predominance of petroleum products in the mix such as commercial transport, private transport (households) and “Others”.
Under a conservative effort (CEET), scenarios depict a disruption of current trends that would improve energy intensity in all sectors due to the substitution of petroleum products with electricity, which would be supported by a capacity expansion mostly of hydropower, solar PV, and wind, considering the vast potential of renewables that the country has. Nevertheless, there would still be a decay in the projected economic activity, which shows the necessity of a more aggressive policies.
A maximum effort towards energy transition shows that policies to improve energy intensity displace the use of petroleum products and reduce oil exports. A more aggressive deployment of power capacity from renewables would certainly avoid energy shortages and guarantee a sustained expected economic growth only under the most optimistic case of oil availability. However, transition technologies like natural gas in heavy duty transport and electricity generation would be necessary.
Findings of this paper show that unless an adequate long-term strategy is implemented soon with the aim of reducing dependency on oil and petroleum products, a profound energy crisis would be foreseeable by 2040. Oil would still play a key role in fossil fuel rich developing countries’ energy future to achieve a moderate-sustained economic growth as all scenarios with the lowest bound of oil availability are incapable of avoiding energy shortages. The long-term strategy should consider a structural change in sectors with high dependency on fossil fuels such as commercial and private transport with the introduction of alternative technologies such as hybrid and electric, along with sustainable mobility (including non-motorized). Furthermore, a more aggressive deployment of renewables should be implemented to support the already high share of these sources in electricity generation and reduce the use of fossil fuels. Finally, a more diversified structure of the economy is mandatory to cut dependency on oil as an income source.
Future work should be focused on assessing the introduction of technologies such as solar thermal for direct use, electric freight train, and hydrogen fueled vehicles. Moreover, considering the importance of oil in fossil fuel rich developing countries’ economy, the effects of reducing exports to avoid an abrupt depletion of reserves should be analyzed.

Supplementary Materials

The following supporting information can be downloaded at https://www.mdpi.com/article/10.3390/en15196938/s1. Document with full scenario descriptions.

Author Contributions

Conceptualization, V.S.E. and M.M.; methodology, V.S.E.; software, V.S.E. and J.F.; formal analysis, V.S.E. and P.R.; investigation, V.S.E. and J.F.; data curation, J.F. and P.R.; writing—original draft preparation, V.S.E. and J.F.; writing—review and editing, J.M.-H. and M.M.; supervision, J.M.-H. and M.M. All authors have read and agreed to the published version of the manuscript.

Funding

This research received no external funding.

Institutional Review Board Statement

Not Applicable.

Informed Consent Statement

Not Applicable.

Data Availability Statement

Not applicable.

Acknowledgments

Gratitude is expressed to the Research Group on Energy, Economy, and System Dynamics of the University of Valladolid for the support in the development of the present work. The authors specially thank the Project Fondo de Investigación Cooperación IKIAM-CIMNE.

Conflicts of Interest

The authors declare no conflict of interest.

Abbreviations

IAMIntegrated Assessment Model
EEDECEcuadorian Energy Development under Energy Constraints
MBblMillion Barrels
URRUltimately Recoverable Resources
BAUBusiness as Usual
CEETConservative Efforts for Energy Transition
MEETMaximum Efforts for Energy Transition
NRENon-Renewable Energy
RESRenewable Energy Sources
TFECTotal Final Energy Consumption

References

  1. Nieto, J.; Carpintero, Ó.; Miguel, L.J.; de Blas, I. Macroeconomic modelling under energy constraints: Global low carbon transition scenarios. Energy Policy 2020, 137, 111090. [Google Scholar] [CrossRef]
  2. Change UNFC on C. Adoption of the Paris Agreement. Report No. FCCC/CP/2015/L. 9/Rev. 1 2015. Available online: https://unfccc.int/resource/docs/2015/cop21/eng/l09r01.pdf (accessed on 16 June 2022).
  3. Gielen, D.; Boshell, F.; Saygin, D.; Bazilian, M.D.; Wagner, N.; Gorini, R. The role of renewable energy in the global energy transformation. Energy Strateg. Rev. 2019, 24, 38–50. [Google Scholar] [CrossRef]
  4. Sovacool, B.K. An international assessment of energy security performance. Ecol. Econ. 2013, 88, 148–158. [Google Scholar] [CrossRef]
  5. Achour, H.; Belloumi, M. Decomposing the influencing factors of energy consumption in Tunisian transportation sector using the LMDI method. Transp. Policy 2016, 52, 64–71. [Google Scholar] [CrossRef]
  6. Vanegas Cantarero, M.M. Of renewable energy, energy democracy, and sustainable development: A roadmap to accelerate the energy transition in developing countries. Energy Res. Soc. Sci. 2020, 70, 101716. [Google Scholar] [CrossRef]
  7. Fattouh, B.; Poudineh, R.; West, R. The rise of renewables and energy transition: What adaptation strategy exists for oil companies and oil-exporting countries? Energy Transit. 2019, 3, 45–58. [Google Scholar] [CrossRef]
  8. Gass, P.; Echeverria, D. Fossil Fuel Subsidy Reform and the Just Transition. 2017. Available online: https://www.iisd.org/system/files/publications/fossil-fuel-subsidy-reform-just-transition.pdf (accessed on 16 June 2022).
  9. González, M.O.A.; Gonçalves, J.S.; Vasconcelos, R.M. Sustainable development: Case study in the implementation of renewable energy in Brazil. J. Clean Prod. 2017, 142, 461–475. [Google Scholar] [CrossRef]
  10. Washburn, C.; Pablo-Romero, M. Measures to promote renewable energies for electricity generation in Latin American countries. Energy Policy 2019, 128, 212–222. [Google Scholar] [CrossRef]
  11. Ministerio de Energía y Recursos Naturales No Renovables M, MERNNR M de E y RNNR. Plan Maestro de Electricidad 2018-2027, 2020, 16. Available online: https://www.recursosyenergia.gob.ec/wp-content/uploads/2020/01/1.-RESUMEN-EJECUTIVO.pdf (accessed on 16 June 2022).
  12. Wesseh, P.K.; Lin, B. Renewable energy technologies as beacon of cleaner production: A real options valuation analysis for Liberia. J. Clean Prod. 2015, 90, 300–310. [Google Scholar] [CrossRef]
  13. Gu, J.; Renwick, N.; Xue, L. The BRICS and Africa’s search for green growth, clean energy and sustainable development. Energy Policy 2018, 120, 675–683. [Google Scholar] [CrossRef]
  14. Zapata S, Castaneda M, Aristizabal AJ, Dyner I. Renewables for supporting supply adequacy in Colombia. Energy 2022, 239, 122157. [Google Scholar] [CrossRef]
  15. Ouedraogo, N.S. Africa energy future: Alternative scenarios and their implications for sustainable development strategies. Energy Policy 2017, 106, 457–471. [Google Scholar] [CrossRef]
  16. Vidadili, N.; Suleymanov, E. Transition to Renewable Energy and Sustainable Energy Development in Azerbaijan; Elsevier: Amsterdam, The Netherlands, 2016; Available online: https://www.researchgate.net/publication/310951836_Transition_to_Renewable_Energy_and_Sustainable_Energy_Development_in_Azerbaijan (accessed on 16 June 2022).
  17. Edalati, S.; Ameri, M.; Iranmanesh, M.; Sadeghi, Z. Solar photovoltaic power plants in five top oil-producing countries in Middle East: A case study in Iran. Renew. Sustain. Energy Rev. 2017, 69, 1271–1280. [Google Scholar] [CrossRef]
  18. Sovacool, B.K. How long will it take? Conceptualizing the temporal dynamics of energy transitions. Energy Res. Soc. Sci. 2016, 13, 202–215. [Google Scholar] [CrossRef]
  19. Delannoy, L.; Longaretti, P.Y.; Murphy, D.J.; Prados, E. Peak oil and the low-carbon energy transition: A net-energy perspective. Appl. Energy 2021, 304, 117843. [Google Scholar] [CrossRef]
  20. Janetos, A.; Clarke, L.; Collins, W.; Ebi, K.; Edmonds, J.; Foster, I.; Jacoby, J.; Judd, K.; Leung, L.; Newell., R.; et al. Science Challenges and Future Directions: Climate Change Integrated Assessment Research. In Dept. Energy Wash.; 2009. Available online: https://science.osti.gov/-/media/ber/pdf/Ia_workshop_low_res_06_25_09.pdf (accessed on 16 June 2022).
  21. Gambhir, A. Planning a Low-Carbon Energy Transition: What Can and Can’t the Models Tell Us? Joule 2019, 3, 1795–1798. [Google Scholar] [CrossRef]
  22. Soria, R.; Lucena, A.F.P.; Tomaschek, J.; Fichter, T.; Haasz, T.; Szklo, A.; Schaeffer, R.; Rochedo, P.; Fahl, U.; Kern, J. Modelling concentrated solar power (CSP) in the Brazilian energy system: A soft-linked model coupling approach. Energy 2016, 116, 265–280. [Google Scholar] [CrossRef]
  23. Capellán-Pérez, I.; de Blas, I.; Nieto, J.; de Castro, C.; Miguel, L.J.; Carpintero, Ó.; Mediavilla, M.; Lobejón, L.F.; Ferreras-Alonso, N.; Rodrigo, P. MEDEAS: A new modeling framework integrating global biophysical and socioeconomic constraints. Energy Environ. Sci. 2020, 13, 986–1017. [Google Scholar] [CrossRef]
  24. Bataille, C.; Waisman, H.; Briand, Y.; Svensson, J.; Vogt-Schilb, A.; Jaramillo, M.; Delgado, R.; Arguello, R.; Clarke, L.; Wild, T. Net-zero deep decarbonization pathways in Latin America: Challenges and opportunities. Energy Strateg. Rev. 2020, 30, 100510. [Google Scholar] [CrossRef]
  25. Jackson, P.M.; Smith, L.K. Exploring the undulating plateau: The future of global oil supply. Philos. Trans. R Soc. A Math Phys. Eng. Sci. 2014, 372, 20120491. [Google Scholar] [CrossRef]
  26. Capellán-Pérez, I.; Mediavilla, M.; de Castro, C.; Carpintero, Ó.; Miguel, L.J. More growth? An unfeasible option to overcome critical energy constraints and climate change. Sustain. Sci. 2015, 10, 397–411. [Google Scholar] [CrossRef]
  27. de Blas, I.; Mediavilla, M.; Capellán-Pérez, I.; Duce, C. The limits of transport decarbonization under the current growth paradigm. Energy Strateg. Rev. 2020, 32, 100543. [Google Scholar] [CrossRef]
  28. Chavez-Rodriguez, M.F.; Carvajal, P.E.; Martinez Jaramillo, J.E.; Egüez, A.; Mahecha, R.E.G.; Schaeffer, R.; Szkloa, A.; Lucenaa, A.F.P.; Aramburo, S.A. Fuel saving strategies in the Andes: Long-term impacts for Peru, Colombia and Ecuador. Energy Strateg. Rev. 2018, 20, 35–48. [Google Scholar] [CrossRef]
  29. Carvajal, P.E.; Li, F.G.N.; Soria, R.; Cronin, J.; Anandarajah, G.; Mulugetta, Y. Large hydropower, decarbonisation and climate change uncertainty: Modelling power sector pathways for Ecuador. Energy Strateg. Rev. 2019, 23, 86–99. [Google Scholar] [CrossRef]
  30. Carvajal, P.E.; Li, F.G.N. Challenges for hydropower-based nationally determined contributions: A case study for Ecuador. Clim. Policy 2019, 19, 974–987. [Google Scholar] [CrossRef]
  31. Instituto Nacional de Eficiencia Energética y Energías Renovables I. Escenarios de Prospectiva Energética para Ecuador a 2050. Quito-Ecuador: INER; 2016. Available online: https://www.researchgate.net/publication/323074582_Escenarios_de_prospectiva_energetica_para_Ecuador_a_2050 (accessed on 16 June 2022).
  32. Espinoza, V.S.; Guayanlema, V.; Martínez-Gómez, J. Energy Efficiency Plan Benefits in Ecuador: Long-range Energy Alternative Planning Model. Int. J. Energy Econ. Policy 2018, 8, 42–54. [Google Scholar]
  33. Castro Verdezoto, P.L.; Vidoza, J.A.; Gallo, W.L.R. Analysis and projection of energy consumption in Ecuador: Energy efficiency policies in the transportation sector. Energy Policy 2019, 134, 110948. [Google Scholar] [CrossRef]
  34. Rivera-González, L.; Bolonio, D.; Mazadiego, L.F.; Naranjo-Silva, S.; Escobar-Segovia, K. Long-Term Forecast of Energy and Fuels Demand Towards a Sustainable Road Transport Sector in Ecuador (2016–2035): A LEAP Model Application. Sustainability 2020, 12, 472. [Google Scholar] [CrossRef]
  35. Rivera-González, L.; Bolonio, D.; Mazadiego, L.F.; Valencia-Chapi, R. Long-Term Electricity Supply and Demand Forecast (2018–2040): A LEAP Model Application towards a Sustainable Power Generation System in Ecuador. Sustainability 2019, 11, 5316. [Google Scholar] [CrossRef]
  36. Arroyo, M.F.R.; Miguel, L.J. The Role of Renewable Energies for the Sustainable Energy Governance and Environmental Policies for the Mitigation of Climate Change in Ecuador. Energies 2020, 13, 3883. [Google Scholar] [CrossRef]
  37. Martínez, J.; Martí-Herrero, J.; Villacís, S.; Riofrio, A.J.; Vaca, D. Analysis of energy, CO2 emissions and economy of the technological migration for clean cooking in Ecuador. Energy Policy 2017, 107, 182–187. [Google Scholar] [CrossRef]
  38. Villamar, D.; Soria, R.; Rochedo, P.; Szklo, A.; Imperio, M.; Carvajal, P.; Schaeffer, R. Long-term deep decarbonisation pathways for Ecuador: Insights from an integrated assessment model. Energy Strateg. Rev. 2021, 35, 100637. [Google Scholar] [CrossRef]
  39. Manley, D.; Cust, J.F.; Cecchinato, G. Stranded Nations? The Climate Policy Implications for Fossil Fuel-Rich Developing Countries. SSRN Electron. J. 2017. [Google Scholar] [CrossRef]
  40. Ministerio de Energía y Recursos Naturales No Renovables M. Plan Maestro de Electricidad 2018-2027 2020:143. Available online: https://www.recursosyenergia.gob.ec/wp-content/uploads/2020/01/4.-EXPANSION-DE-LA-GENERACION.pdf (accessed on 16 June 2022).
  41. Ministerio de Electricidad y Energía Renovable, M. Atlas Bioenergético del Ecuador 2014:87-95,129-140,149. Available online: https://www.ariae.org/servicio-documental/atlas-bionergetico-de-la-republica-del-ecuador (accessed on 16 June 2022).
  42. Organización Latinoamericana de Energía, O. Análisis de los Impactos de la Pandemia del COVID-19 Sobre el Sector Energético de América Latina y el Caribe. Quito: OLADE; 2020. Available online: https://biblioteca.olade.org/opac-tmpl/Documentos/old0452.pdf (accessed on 17 June 2022).
  43. Ministerio de Energía y Recursos Naturales No Renovables M. Balance Energético Nacional 2020 2021. Available online: https://www.recursosyenergia.gob.ec/wp-content/uploads/2021/09/Balance-Energe%CC%81tico-Nacional-2020-Web.pdf (accessed on 16 June 2022).
  44. Espinoza, V.S.; Fontalvo, J.; Martí-Herrero, J.; Ramírez, P.; Capellán-Pérez, I. Future oil extraction in Ecua dor using a Hubbert approach. Energy 2019, 182, 520–534. [Google Scholar] [CrossRef]
  45. Administration, U.S.E.I. Ecuador: Analysis n.d. Available online: https://www.eia.gov/international/analysis/country/ECU (accessed on 14 January 2022).
  46. MERNNR M de E y RNNR. Informe Anual del Potencial Hidrocarburífero del Ecuador 2019 2020. Available online: https://www.recursosyenergia.gob.ec/wp-content/uploads/2020/09/Resumen-Infor.P..Hidro-Pa%C3%ADs-2019.-Revi1C.Ruiz_.1.pdf (accessed on 16 June 2022).
  47. BCE BC del E. Evolución de la Balanza Comercial Enero-Diciembre 2020. 2021. Available online: https://contenido.bce.fin.ec/documentos/Estadisticas/SectorExterno/BalanzaPagos/balanzaComercial/ebc202102.pdf (accessed on 17 June 2022).
  48. BCE BC del E. Cuentas Nacionales Anuales 2021. Available online: https://contenido.bce.fin.ec/documentos/Administracion/bi_menuCNAde_f.html (accessed on 17 June 2022).
  49. Agencia de Regulación y Control de la Electricidad A. Estadística Anual y Multianual del Sector Eléctrico Ecuatoriano 2017 2018:7–9. Available online: https://www.controlrecursosyenergia.gob.ec/wp-content/uploads/downloads/2020/08/estadistica%20reducida.pdf (accessed on 17 June 2022).
  50. Program ESMA. Global Photovoltaic Power Potential by Country; World Bank: Washington, DC, USA, 2020. [Google Scholar]
  51. Jara Alvear, J. Solar Photovoltaic Potential to Complement Hydropower in Ecuador: A GIS-Based Framework of Analysis. Master’s Thesis, Lund University, Lund, Sweden, 2018. [Google Scholar]
  52. Ministerio de Energía y Recursos Naturales No Renovables M. Plan Maestro de Electricidad 2018-2027 2020:150,151. Available online: https://www.recursosyenergia.gob.ec/wp-content/uploads/2020/01/4.-EXPANSION-DE-LA-GENERACION.pdf (accessed on 16 June 2022).
  53. Espinoza, V.S.; Fontalvo, J.; Martí-Herrero, J.; Miguel, L.J.; Mediavilla, M. Analysis of energy future pathways for Ecuador facing the prospects of oil availability using a system dynamics model. Is degrowth inevitable? Energy 2022, 259, 124963. [Google Scholar] [CrossRef]
  54. Capellán Pérez, I.; Mediavilla, M.; de Castro, C.; Carpintero, Ó.; Miguel, L.J. Fossil fuel depletion and socio-economic scenarios: An integrated approach. Energy 2014, 77, 641–666. [Google Scholar] [CrossRef]
  55. Organización Latinoamericana de Energía O. Manual de Planificación Energética 2017:183,184. Available online: https://www.olade.org/wp-content/uploads/2021/03/Manual_Planificacion_Energetica_Espanol_Final22-05-2017.pdf (accessed on 17 June 2022).
  56. International Energy Agency IEA. Energy Transitions Indicators 2019. Available online: https://www.iea.org/articles/energy-transitions-indicators (accessed on 17 June 2022).
  57. International Energy Agency IEA. World Energy Model; IEA: Paris, France, 2020; Available online: https://www.iea.org/reports/world-energy-model (accessed on 17 June 2022).
  58. FES-Ecuador. Laboratorio de Transición Energética 2017. Available online: http://www.fes-ecuador.org/news-list/e/laboratorio-de-transicion-energetica/ (accessed on 30 June 2021).
  59. Noboa, E.; Upham, P. Energy policy and transdisciplinary transition management arenas in illiberal democracies: A conceptual framework. Energy Res. Soc. Sci. 2018, 46, 114–124. [Google Scholar] [CrossRef]
  60. Ministerio de Electricidad y Energía Renovable M. Plan Nacional de Eficiencia Energética 2016-2035 2017:59. Available online: https://drive.google.com/file/d/1dBDzwH87S7mmR0Gz1tc73WxaCJ8WvnM1/view (accessed on 17 June 2022).
  61. Secretaría de Hidrocarburos S. Informe Anual del Potencial Hidrocarburífero del Ecuador 2017 2018:17,80. Available online: https://www.recursosyenergia.gob.ec/wp-content/uploads/2019/11/Informe-Anual-del-Potencial-Hidrocarburi%CC%81fero-del-Ecuador-2018.pdf (accessed on 17 June 2022).
  62. Ministerio de Energía y Recursos Naturales No Renovables M. Balance Energético Nacional 2017 2018:33. Available online: https://issuu.com/revistavirtualmrnnr/docs/balance_energe_tico_nacional_2017 (accessed on 17 June 2022).
  63. Agencia de Regulación y Control de la Electricidad A. Estadística Anual y Multianual del Sector Eléctrico Ecuatoriano 2018 2019:7–9. Available online: https://www.controlrecursosyenergia.gob.ec/wp-content/uploads/downloads/2020/08/Estad%C3%ADsticaAnualMultianual2018.pdf (accessed on 17 June 2022).
  64. Ministerio de Energía y Recursos Naturales No Renovables M. Balance Energético Nacional 2017 2018:99. Available online: https://issuu.com/revistavirtualmrnnr/docs/balance_energe_tico_nacional_2017 (accessed on 17 June 2022).
  65. Ministerio de Electricidad y Energía Renovable M. Plan Nacional de Eficiencia Energética 2016-2035 2017:27. Available online: https://drive.google.com/file/d/1dBDzwH87S7mmR0Gz1tc73WxaCJ8WvnM1/view (accessed on 17 June 2022).
  66. Asamblea Nacional del Ecuador. Ley Orgánica de Eficiencia Energética n.d. Available online: www.registroficial.gob.ec (accessed on 25 May 2022).
  67. Presidencia de la República del Ecuador. Decretos 675. Dispónese que la Gasolina ECOPAÍS Estará Compuesta por un Porcentaje de Hasta el 10% de Bioetanol Anhidro, Grado Carburante, y la Diferencia por Naftas Necesarias para Alcanzar el Número de Octanos que Establece la Correspondiente Norma INEN n.d. Available online: https://vlex.ec/vid/disponese-gasolina-ecopais-compuesta-583918334 (accessed on 25 May 2022).
  68. Kermeli, K.; Graus, W.H.J.; Worrell, E. Energy efficiency improvement potentials and a low energy demand scenario for the global industrial sector. Energy Effic. 2014, 7, 987–1011. [Google Scholar] [CrossRef]
  69. Graus, W.; Blomen, E.; Worrell, E. Global energy efficiency improvement in the long term: A demand- and supply-side perspective. Energy Effic. 2011, 4, 435–463. [Google Scholar] [CrossRef]
  70. International Energy Agency IEA. World Energy Oulook 2019; International Energy Agency: Paris, France, 2019. [Google Scholar]
  71. Van de Graaf, T.; Verbruggen, A. The oil endgame: Strategies of oil exporters in a carbon-constrained world. Env. Sci. Policy 2015, 54, 456–462. [Google Scholar] [CrossRef]
  72. International Energy Agency IEA. Global EV Policy Explorer Electric Vehicle Deployment Policies and Measures. 2021. Available online: https://www.iea.org/articles/global-ev-policy-explorer (accessed on 17 June 2022).
  73. Lah, O.; Fulton, L.; Arioli, M. Decarbonization Scenarios for Transport and the Role of Urban Mobility. Sustain. Urban Mobil Pathw. Policies Inst. Coalit. Low Carbon Transp. Emerg. Ctries 2019, 65–80. [Google Scholar] [CrossRef]
  74. International Energy Agency IEA. Global EV Outlook 2020 Entering the Decade of Electric Drive? 2020. Available online: https://www.iea.org/reports/global-ev-outlook-2020 (accessed on 17 June 2022).
  75. IEA. Energy Transitions—Topics—IEA 2021. Available online: https://www.iea.org/topics/energy-transitions (accessed on 17 June 2022).
  76. Arslan-Ayaydin, Ö.; Khagleeva, I. Geopolitical Market Concentration (GMC) Risk of Turkish Crude Oil and Natural Gas Imports; Springer: Berlin/Heidelberg, Germany, 2014; pp. 103–117. [Google Scholar]
  77. Meléndez, Á. Ecuador Has ‘World Class’ Deposits, But Mining Sector Faces Challenges to Growth n.d. Available online: https://www.bloomberglinea.com/2022/01/11/ecuador-has-world-class-deposits-but-mining-sector-faces-challenges-to-growth/ (accessed on 10 September 2022).
  78. Soria, R.; Caiza, G.; Cartuche, N.; López-Villada, J.; Ordoñez, F. Market potential of linear Fresnel collectors for solar heat industrial process in Latin-America-A case study in Ecuador. AIP Conf. Proc. 2020, 2303, 120003. [Google Scholar] [CrossRef]
  79. Kruyt, B.; van Vuuren, D.P.; de Vries, H.J.M.; Groenenberg, H. Indicators for energy security. Energy Policy 2009, 37, 2166–2181. [Google Scholar] [CrossRef]
  80. Jansen, J.C.; van Arkel, W.G.; Boots, M.G. Designing Indicators of Long-Term Energy Supply Security 2004. Available online: https://inis.iaea.org/search/search.aspx?orig_q=RN:35036141 (accessed on 17 June 2022).
  81. Grubb, M.; Butler, L.; Twomey, P. Diversity and security in UK electricity generation: The influence of low-carbon objectives. Energy Policy 2006, 34, 4050–4062. [Google Scholar] [CrossRef]
  82. Gupta, E. Oil vulnerability index of oil-importing countries. Energy Policy 2008, 36, 1195–1211. [Google Scholar] [CrossRef]
  83. Martchamadol, J.; Kumar, S. An aggregated energy security performance indicator. Appl. Energy 2013, 103, 653–670. [Google Scholar] [CrossRef]
  84. Martchamadol, J.; Kumar, S. The Aggregated Energy Security Performance Indicator (AESPI) at national and provincial level. Appl. Energy 2014, 127, 219–238. [Google Scholar] [CrossRef]
Figure 1. Schematic overview of EEDEC model [53].
Energies 15 06938 g001
Figure 2. Evolution of (a) Oil extraction, (b) Petroleum Products production, and (c) Oil reserves depletion per scenario.
Energies 15 06938 g002aEnergies 15 06938 g002b
Figure 3. Evolution of (a) Electricity generation and demand, (b) Installed capacity per scenario.
Energies 15 06938 g003aEnergies 15 06938 g003b
Figure 4. Evolution of energy demand per sector and scenario.
Energies 15 06938 g004
Figure 5. Evolution of economic activity per sector and scenario.
Energies 15 06938 g005
Figure 6. Evolution of energy intensity per sector and scenario.
Energies 15 06938 g006
Figure 7. Evolution of energy demand per source and scenario.
Energies 15 06938 g007
Figure 8. Evolution of Total Fleet and Technology share per scenario for (a) Households vehicles, (b) Bus (c) Heavy Duty, (d) Low Duty. (e) VAN.
Energies 15 06938 g008aEnergies 15 06938 g008b
Figure 9. Evolution of GHG emissions per scenario.
Energies 15 06938 g009
Table 1. Scenarios modeled in EEDEC.
StorylineScenarioDescription
BAUBAU_2PThis scenario follows current trends. It considers a national oil availability of 7800 MBbl.
BAU_OSimilar to BAU_2P scenario but considers national oil availability of 10,700 MBbl
Conservative Energy TransitionCEET_2PThis scenario includes policies that will seek to reduce dependency on fossil fuels. Targets are moderate.
CEET_OSimilar to CEET_2P scenario but considers national oil availability of 10,700 MBbl
Ambitious Energy TransitionMEET_2PThis is a disruptive scenario that implements a strong, proactive energy transition.
MEET_OSimilar to MEET_2P scenario but considers national oil availability of 10,700 MBbl
Table 2. Scenario main assumptions.
SectorParameterScenarios
BAUCEETMEET
TransportShare Hybrid Low DutyWill follow current trends20% by 205030% by 2050
Share Electric Low Duty18% by 205028% by 2050
Share Hybrid Heavy Duty5% by 205015% by 2050
Share Nat. Gas Heavy Duty20% by 205040% by 2050
Share Electric Bus35% by 205085% by 2050
Share Hybrid VAN10% by 205030% by 2050
Share Electric VAN20% by 205040% by 2050
Transport HouseholdsShare 2 wheelersWill follow current trends55% by 2050 a60% by 2050 a
Share Hybrid 4 wheelers20% by 2050 b30% by 2050 b
Share Electric 4 wheelers18% by 2050 b28% by 2050 b
Share Electric 2 wheelers30% by 2050 c60% by 2050 c
Share Sustainable Mobility10% by 2050 b20% by 2050 b
HouseholdsEnergy Intensity ImprovementWill follow current trendsElectricity with slow exponential improvement at max yearly rate of 2%Electricity with fast exponential improvement at max yearly rate of 4%
Source SubstitutionNo substitutionLPG with electricity. Slow exponential substitution at max yearly rate of 1.1% LPG with electricity. Fast exponential substitution at max yearly rate of 3%
IndustryEnergy Intensity ImprovementWill follow current trendsNatural Gas, electricity, LPG, Diesel, and Fuel Oil slow exponential improvement at max yearly rate of 9% Natural Gas, electricity, LPG, Diesel, and Fuel Oil fast exponential improvement at max yearly rate of 9%
Source SubstitutionNo substitutionLPG with Natural Gas (30%), Electricity (70%)LPG with Electricity (70%), and biomass (30%)
Slow exponential substitution at max yearly rate of 16%Fast exponential substitution at max yearly rate of 16%
Diesel with Natural Gas (20%), Electricity (80%)Diesel with Electricity (80%), and biomass (20%)
Slow exponential substitution at max yearly rate of 13%Fast exponential substitution at max yearly rate of 13%
Fuel Oil with Natural Gas (20%), Electricity (80%)Fuel Oil with Natural Gas (20%), Electricity (80%)
Slow exponential substitution at max yearly rate of 12%Fast exponential substitution at max yearly rate of 12%
Commercial-PublicEnergy Intensity ImprovementWill follow current trendsElectricity, LPG, Gasoline, Diesel, and Fuel Oil slow exponential improvement at max yearly rate of 4%Electricity, LPG, Gasoline, Diesel, and Fuel Oil fast exponential improvement at max yearly rate of 4%
Source SubstitutionNo substitutionLPG with Electricity LPG with Electricity
Slow exponential substitution at max yearly rate of 4% Fast exponential substitution at max yearly rate of 4%
Diesel with Electricity Diesel with Electricity
Slow exponential substitution at max yearly rate of 4% Fast exponential substitution at max yearly rate of 4%
Fuel Oil with ElectricityFuel Oil with Electricity
Slow exponential substitution at max yearly rate of 4% Fast exponential substitution at max yearly rate of 4%
OthersEnergy Intensity ImprovementWill follow current trendsElectricity, LPG, Gasoline, Diesel, and Fuel Oil slow exponential improvement at a max yearly rate of 7% Electricity, LPG, Gasoline, Diesel, and Fuel Oil fast exponential improvement at a max yearly rate of 7%
Source SubstitutionNo substitutionLPG with Electricity LPG with Electricity
Slow exponential substitution at max yearly rate of 4% Fast exponential substitution at max yearly rate of 10%
Diesel with Electricity Diesel with Electricity
Slow exponential substitution at max yearly rate of 2% Fast exponential substitution at max yearly rate of 6%
Fuel Oil with Electricity Fuel Oil with Electricity
Slow exponential substitution at max yearly rate of 1%Fast exponential substitution at max yearly rate of 3%
Power CapacityPlanned Installed Capacity for Renewables up to 2027Base Case Electricity Master Plan [52]Productive Matrix Case Electricity Master Plan [52]Productive Matrix Case Electricity Master Plan [52]
Growth Rate of Installed Capacity for Renewables from 2027Hydro: 7.8%Hydro: 9.4%Hydro: 13.5%
Wind: 30.8%Wind: 37%Wind: 53.2%
Solar PV: 69%Solar PV: 83%Solar PV: 119%
Geothermal: 0%Geothermal: 0%Geothermal: 0%
Biomass: 6.1%Biomass: 7.3%Biomass: 10.5%
Biogas: 11.3%Biogas: 13.6%Biogas: 19.6%
Renewables PotentialHydroHydro: 22,000 Mwe [11]Hydro: 22,000 Mwe [11]Hydro: 22,000 Mwe [11]
WindWind: 884 Mwe [11]Wind: 884 Mwe [11]Wind: 884 Mwe [11]
Solar PVSolar PV: 16,637 MWp [51]Solar PV: 16,637 MWp [51]Solar PV: 16,637 MWp [51]
GeothermalGeothermal: 2700 MWth [11]Geothermal: 2700 MWth [11]Geothermal: 2700 MWth [11]
BiomassBiomass: 92,233 TJ/Year [41]Biomass: 230,584 TJ/Year [41]Biomass: 230,584 TJ/Year [41]
BiogasBiogas: 223.4 TJ/Year [41]Biogas: 223.4 TJ/Year [41]Biogas: 223.4 TJ/Year [41]
Oil Oil Export PolicyMaximum exportsReduced exports dOil sovereignty e
Fossil FuelsFossil Fuels PricesStated Policies [57]Sustainable Development [57]Sustainable Development [57]
a Share of total household vehicles (2 wheelers + 4 wheelers) b Share in 4 wheelers c Share in 2 wheelers. d Exports include oil embedded in imports plus a fraction of national oil demand (30% by default). e Exports include only the amount of oil embedded in imported petroleum products necessary to cover domestic demand.
Table 3. Comparison of GDP per capita and Total Final Energy Consumption per capita for EEDEC and MEDEAS.
IndicatorYearEEDEC 1 BAU_2PEEDEC 1 BAU_OEEDEC 1 CEET_2PEEDEC 1 CEET_OEEDEC 1 MEET_2PEEDEC 1 MEET_OMEDEAS Ref [23]
GDP per capita [USD1995/person]20202819281928192819281928197300
20253044304430443044304430447400
20303281328132813281328132817500
20353561356135613561356135617700
20403602374838923892389238927600
20453511372540134281428142497500
20503421380142004480445447397400
TFEC per capita [GJ/person]202029313131313155
202531292929292954
203033313131313153
203536333333323252
204037363636323251
204534383838333350
205031373539343349
1 EEDEC GDP was converted to 1995 USD.
Table 4. Evolution of Energy Transition Indicators per scenario.
Scenario
IndicatorYearBAU_2PBAU_OCEET_2PCEET_OMEET_2PMEET_OStated Policies IEA [56,75]Sustainable Development IEA [56,75]
Final Energy Carbon Intensity [TON CO2eq/TJ]202058.558.558.558.558.558.5
202556.656.656.656.656.656.6
203055.455.355.255.155.455.4
203554.254.253.553.453.653.6
204052.552.852.352.351.051.066.8 [56] 40.6 [56]
204549.049.650.751.349.449.5
205044.045.849.049.848.448.6
Power Carbon Intensity [TON CO2eq/GWh]2020192.6192.6192.6192.6193.0193.0
2025234.0234.0217.0217.0217.4217.4
203083.083.083.283.283.783.7
2035104.6105.9129.3132.982.082.1
2040178.7197.0173.6174.7140.3139.7
2045194.8206.498.6139.8168.2142.7
2050178.5198.083.483.080.9126.7225.6 [75]17.0 [75]
Electricity Share in final demand [%]202017.9817.9817.9817.9817.9817.98
202520.0620.0620.0620.0620.0620.06
203021.3521.3921.5421.6521.1221.13
203522.5722.6223.2723.4222.4622.46
204024.8624.3424.1324.2524.7824.7627 [56]33 [56]
204529.7828.8525.6624.7626.3926.28
205036.9634.2927.1125.9027.6827.05
Publisher’s Note: MDPI stays neutral with regard to jurisdictional claims in published maps and institutional affiliations.

