Article

Multicriteria Decision Analysis of Suitable Location for Wind and Photovoltaic Power Plants on the Galápagos Islands

by
Geovanna Villacreses
1,
Diego Jijón
1,
Juan Francisco Nicolalde
2,*,
Javier Martínez-Gómez
1,2,3 and
Franz Betancourt
1
1
Instituto de Investigación Geológico y Energético (IIGE), Quito 170518, Ecuador
2
Facultad de Ingeniería y Ciencias Aplicadas, Universidad Internacional SEK, Quito 170302, Ecuador
3
(Área de Ingeniería Mecánica) Escuela Politécnica, Departamento de Teoría de la Señal y Cón, Universidad de Alcalá, 28805 Alcalá de Henares, Spain
*
Author to whom correspondence should be addressed.
Energies 2023, 16(1), 29; https://doi.org/10.3390/en16010029
Submission received: 18 October 2022 / Revised: 16 November 2022 / Accepted: 27 November 2022 / Published: 20 December 2022

Abstract

:
The Galapagos Islands have been declared a World Heritage site due to their unique biodiversity, which makes them a living museum and a natural laboratory for humankind. However, to fulfill the energy needs of its habitants and foreign visitors, the islands have depended on fossil fuel energies that have produced levels of lead and chemical agents that are affecting the islands’ air quality, flora, and fauna. Therefore, zero-carbon initiatives have been created to protect the islands, wherein solar and wind power plants have been studied as reliable alternatives. In this way, Geographical Information Systems based on Multicriteria Decision Methods constitute a methodology that minimizes the destruction and disturbance of nature in order to assess the best location for the implementation of these alternative energy sources. Therefore, by exploring the geographical information along with the Analytical Hierarchical Processes and the Ordered Weighted Average methods, it was possible to identify the potential for solar power plants of 10 MW on each island; likewise, for wind power plants, it was found that the islands possess implementation potential that has been analyzed in the field, showing that the best location is on Baltra Island, but is not limited to it.

1. Introduction

The expansion of the population has led to an increasing demand for energy, whose annual growth rate is estimated to represent a rate of about 2%, which has a direct impact on the utilization of fossil fuels. In this way, the consumption of fuels has become an environmental problem since it is responsible for greenhouse gases whose concentration has been rising [1]. In this sense, the decarbonization of energy systems has been developed as an important trend over the past two decades [2], wherein renewable energy sources are a clean option [3] with which to reduce greenhouse gas emissions [4]. Furthermore, it has been identified that the second-best continent, with respect to Clean Development Mechanism projects, is South America [5]. Accordingly, different studies have been performed in Latin America regarding renewable energy projects, such as the research of Icaza et al., who projected a capacity of 880 MW of hydro energy, 630 MW of wind power, 720 MW of solar power, 160 MW of geothermal power, and 50 MW of biomass energy for the year 2050 for the city of Cuenca, Ecuador [6]. In this sense, the different contributions of the scientific community in Latin America help to reach a sustainable and clean goal in each of its regions.

1.1. Renewable Energy in the Galápagos Islands

The Galápagos Islands have been acknowledged as a World Heritage site by UNESCO since they constitute the second-largest marine reserve on the planet [7]; therefore, they are a protected area because of their biodiversity [8] since there are numerous unique endemic species that allow this island to be considered a living museum [9] and a natural laboratory [10]. However, the Galápagos hosted 32.000 habitants in 2018 with an average growth rate of 7% per year [11], while in 2017, it was reported that the islands received 167.011 foreign visitors [12], contributing to one of the fastest-growing economies in the world [13]. This is a considerable number since the tourism sector represents the third largest non-oil income source of Ecuador [12], making it an important topic with respect to preserving the natural conditions of the Islands while at the same time satisfying the needs of the resident population and the tourists. Thus, to cover the electrical needs of the people and the Charles Darwin Research Facility, power generators for thermoelectricity have been used since 1961 [9]; however, studies such as those conducted by Parra et al. have suggested that the Galapagos Islands have the potential to exceed the energy demand by nearly eight times its needs using wind and solar energy [14] and the research of Benalcazar et al. concluded that the optimal energy supply system for the islands might be a hybrid energy source constituting a photovoltaic, wind, and battery system along with a leveled cost of energy [15]. Furthermore, the research of Icaza-Alvarez et al. analyzed the proposal of the decarbonization of the islands with the objective of eliminating the Galapagos’ dependence on fossil fuels that has led to a negative impact on the population, the tourists, and, especially, the native biodiverse flora and fauna that have presented harmful levels of lead and chemical agents, making the change to renewable energy sources a requirement for the islands [7]. Accordingly, the Ecuadorian government has implemented the Zero Fossil Fuel in Galápagos initiative [16] to preserve this ecological heritage by reducing its carbon footprint impact; in this context, to become a world-class reference for sustainability and energy management [17], until 2019, the initiative received an investment of USD 55 million to incorporate renewable energy projects with the objective of producing levels of Eolic and solar energy of 9.1 MW on the islands of San Cristobal, 15 MW on Santa Cruz, 1.8 MW on Isabela, and 0.17 MW on Floreana by the year 2025 [18]. Furthermore, several studies on the feasibility of energy planning on the island have been performed, whose methods use input variables regarding parameters such as wind speed, solar irradiation, and electricity consumption on the most significant islands, namely Baltra, San Cristobal, and Santa Cruz [19].
On the other hand, the solar Atlas of Ecuador indicates that the highest radiation point on the Galapagos Islands is located on the island of San Cristobal, with an average solar incidence of 6.1 kWh∗m−2 per day, which is greater than the values obtained in the continental territory [20]; furthermore, the location of Baltra has a photovoltaic system of 0.067 MWp that produces 136 MWh per year, and the Puerto Ayora photovoltaic power plant has a system of 1.5 MWp that produces 2.430 MWh per year [21]. Moreover, in the case of Eolic energy, it has been established that throughout the year, the average wind speed measured is 6.36 m∗s−1 on the Baltra island [22]. Due to the fact that this technology has become important for the renewable energy sector [23], it was implemented in 2007 in the wind power plant “El Tropezón” on the island of San Cristobal with a capacity of 2.4 MW, followed by a second wind power plant located in Baltra with a capacity of 2.25 MW, for which it was reported that both contributed 15.64% of the renewable energy in 2015 [24]. In this sense, the alternative energy projects produced savings of 2.9 million diesel gallons in 9 years [24] and avoided the emissions of nearly 7.282.6 tons of CO2 per year [21].

1.2. Geographic Information System (GIS)

Furthermore, it has been established that the production of new renewable energy is key to the development of mixed, sustainable energy options [25]. Accordingly, wind and solar power plants must be evaluated; moreover, it is important to consider that the implementation of solar power plants requires extensive territory that can not interfere with the protected natural reserve [13], prioritizing the minimization of disturbance and destruction [26]. In this way, the Geographic Information System (GIS) platform, along with existing cartographic layers, is used to find the best sites for the implementation of renewable energy sources [27] by combining and transforming the geographical data into useful information, which can be managed to be used in the decision-making process to identify the most suitable location for renewable energy plants [28]. Even more, the GIS-based qualitative and quantitative techniques have proved to be useful in preparing susceptibility maps [29]. In this way, the research of Amjad and Shah used the GIS methodology for data acquisition and mapping the implementation of solar power plants in Pakistan, finding high-potential solar locations. Furthermore, the researchers analyzed the terrain’s ruggedness to reduce the development cost [30]. In this sense, the GIS has proved to be an excellent tool to assess the technical and economical wind potential in continental and island applications [31], along with the identification of potential locations for solar power plants that are economically profitable. In this way, considering that achieving highly effective results is a costly procedure that considers several factors [32], the GIS represents a dominant tool for storing, using and assessing solar energy spatial data [33]. In this way, previous researchers that used GIS determined, that in the Ecuadorian territory, the best suitable options for solar energy plants can be found in Loja, Pichincha and Galápagos [34], showing that the data obtained by GIS allow sustainable mapping that combines the potentially unrelated data in a meaningful way [35].

1.3. Multiple Criteria Decision Making (MCDM) Methods

On the other hand, the decision-making is not enough to analyze the many aspects required for the implementation of renewable energy projects. In this sense, the multicriteria decision method is a well-known tool to compare alternatives and make the best decision [5] since it is described as an operational evaluation support approach that has been proven to be useful in the solution of complex problems that consider uncertainty, conflicting objectives, different types of data and diverse perspectives [36]. In this way, MCDM methods have been applied in the assessment of renewable energy alternatives globally, nationally, regionally, or particularly such as in single residential buildings [37]. In the same way, for photovoltaic solar plants, MCDM methods have solved the site problem by considering criteria such as electrical and communication infrastructure without leaving behind the environmental and economic feasibility [38]. In this way, the investigations have used different methods to establish the location of solar power plants, such as AHP, TOPSIS, ELECTRE and VIKOR, where the results produced precise solutions [39]. Furthermore, regarding the data that can be obtained from GIS and taking into consideration the limitations of these criteria to select an implementation site, the MCDM methods can be used to make a decision considering the subjective and conflicting criteria [40] using technical, environmental, topography, economic and social aspects data [41]. In this sense, the Analytical Hierarchy Process (AHP) has been proven to be useful in the determination of photovoltaic farms in southern Morocco since it is a mathematical tool used to analyze complicated decision that requires a pairwise comparison of the criteria [42]. On the other hand, the Ordered Weighted Average (OWA) is based on the principles of the relative significance of weighted criteria and other criteria, meaning that it assesses each criterion in every location and the importance of every criterion for its location [43]. In this way, the research of the author Li used the OWA operator to integrate 26 indexes extracted from the GIS database in wind farm applications [44]. Moreover, the OWA method has been used along with the AHP method, where the derived weights have been used to evaluate the degree of satisfaction to rank the alternatives [45]. Al-Yahyai et al. used these methods to report that the locations of Dhofar and Wusta in Oman are suitable for the implementation of wind farms, showing a proportional degree of optimism for the application [45].

1.4. GIS with MCDM Methodology

The GIS-Based approach has been frequently implemented with the utilization of multicriteria decision methods, such as the AHP, to identify the potential locations for the application of renewable energy power plants [46], considering criteria such as techno-economics, social-environmental [47], biodiversity conservation and production safety [48], allowing the validation of the mapping performed by GIS [49]. On the other hand, GIS technology has been used with the OWA technique to analyze potential natural hazards since it is considered one of the best MCDM methods [50]. In this way, the capability of the OWA method to apply different operators has shown progress in solving real-world environmental problems [51]. Hence, the integration between the GIS-MCDM has been developed as a highly useful tool that can deal with extensive areas and rich geographical information available [52]. Furthermore, using the GIS-MCDM in unison is taking advantage of its complementary nature [40] to successfully select the best locations to establish wind and solar power plants. Furthermore, recent research has made some developments in addressing the applicability of GIS-MCDM in offshore site assessment. The GIS-MCDM using the AHP method has successfully provided maps for offshore wind energy regarding the lack of a general approach [53]. In this way, research with GIS-MCDM for the implementation of wind farms in continental Ecuador has shown a great correlation between multicriteria decision methods and the corresponding results of the best site selection [54]. In this sense, these parameters consisted of wind speed, air, topological relief or slope, distances to the substations, the road network, urban areas, transmission lines and environmental aspects such as vegetation coverage, leading to the result that the location with the best performance index to implement a wind power plant has an area greater than 617,5 km2 located on the Andean region [54]. On the other hand, the investigation performed by Zambrano-Asanza et al. used the GIS-MCDM technique to assess the optimal site for the implementation of photovoltaic power plants in Ecuador; the criteria that were considered using the information obtained by GIS included land and cover, distances to power lines, main roads, urban areas, solar irradiation, average temperature and the orographic aspect of the slope. These selections showed the best locations to build photovoltaic power plants and helped to contribute to the diversification of renewable energy sources in the country [3]. Even more, the investigations undertaken to assess the implementation of wind and solar power plants using GIS-MCDM with scientific bases had provided solutions to complex decision-making problems, where the results should increase the interest of stakeholders to invest in the transformation to renewable energy power plants [55]. In this sense, the present research has the objective of using the Geographical Information System to assess the best location for the expansion and implementation of wind and photovoltaic power plants in the Galapagos Islands using MCDM methods, such as the AHP method, to weigh the criteria, and the OWA method, to assess the criteria.

2. Materials and Methods

Considering that 96.7% of the land surface of the Galapagos Islands is considered a protected area, the present research used computational resources along with mathematical techniques to assess the best options to implement renewable energy power plants, considering that this proposal will allow reducing the utilization of fossil fuels to provide energy to the touristic areas, research facilities and urban zones. In this way, the investigation was carried out using a methodology based on spatial techniques for multicriteria evaluation (MCE) within geographic information systems, where the analyses were performed on raster layers at a spatial resolution of 200 × 200 m (both in x and y).

2.1. Geographical Information System and Study Areas

The present research has considered cartographic information collected from several relevant official sources in the prioritization of wind and solar power generation locations, such as an average speed that may vary from nearly 4 m ∗ s−1 to 7 m ∗ s−1, and for the solar resources, the zone presents average daily radiation of 5.70 kWh ∗ m−2 ∗ day [19]. The criteria that positively or negatively influence the level of priority for the locations were called factors, and the restrictions refer to the layers of information that limit the construction of the energy plants, either due to political–environmental issues or natural risk [54]. In this way, Table 1 summarizes the information layers selected for the evaluation of both wind and solar power plants, considering the previous research performed in the continental territory.
The localization of the best-suited areas for the implementation of renewable energy power plants required the utilization of GIS at different stages, allowing the transformation of the geographical data into useful information for decision-making [4,28]. In this sense, the different data models of vector and raster can be used. The vector model represents the geographical objects as vector features, and they are considered suitable for representing boundaries [28]. On the other hand, the raster model uses a representation by pixel grids that stores the information of every cell, considering it an alternative location [4,28]. Furthermore, the multicriteria evaluation requires that the input data be in raster format; for this reason, converting the files from a vector to a raster format (rasterization) is a necessary step before the analysis [56]. In this way, to transform a vector map made of points, lines or polygons to a raster format, it is necessary to establish a grid of a known extension whose precision is defined by the size of its cells (pixel). In this case, the pixel size is 200 × 200 m, and the extension covers the entire Archipelago.
Furthermore, among the rasterization processes, the type of variable to be transformed was also considered since each one has different behaviors. In this sense, on certain occasions, a raster model derived from the original information is required, while in others, the vector forms are simply converted to raster [56]. The rasterization processes of the values applied to the different coverages are shown in Table 2 for the information referring to the wind and solar power plants.

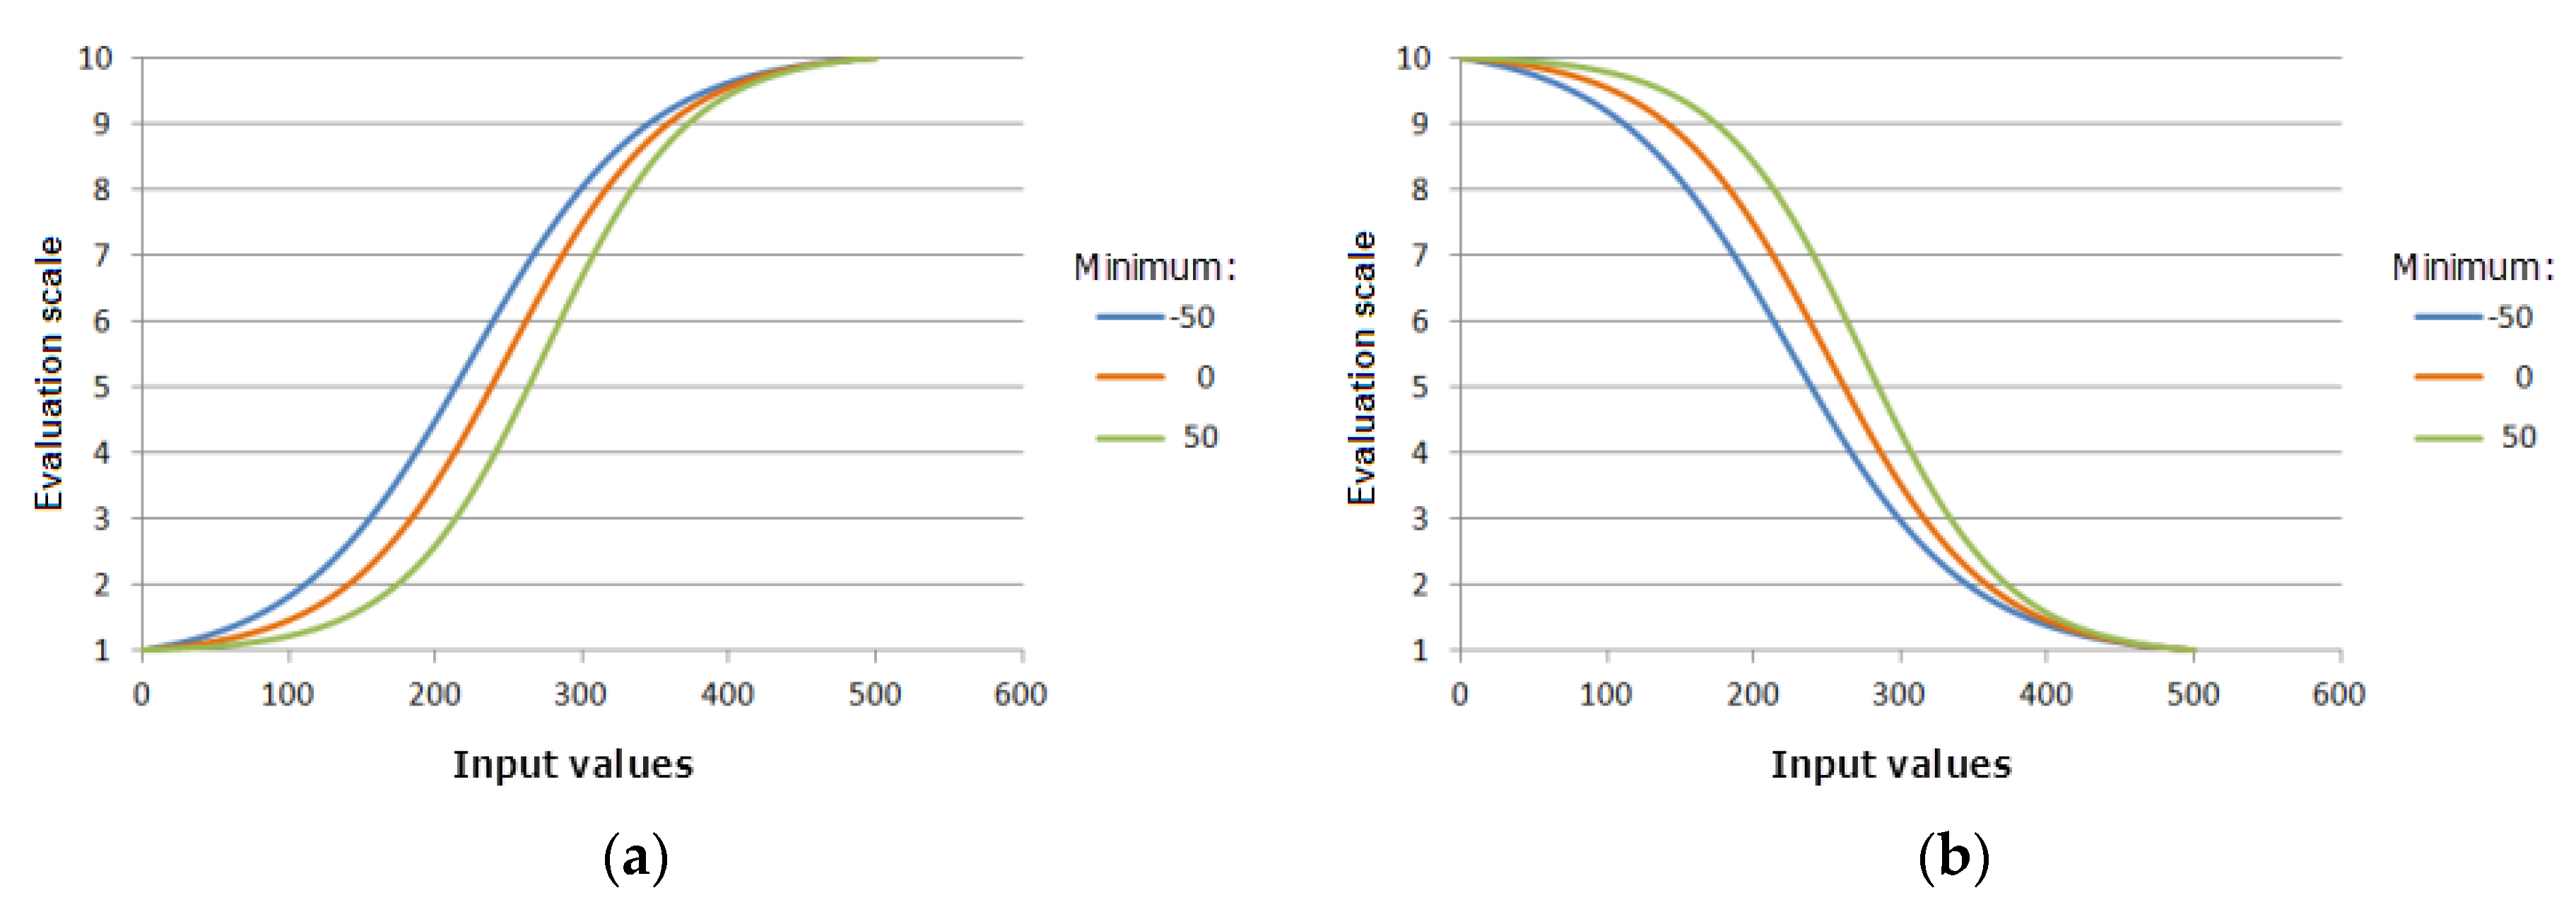
2.2. Standardization

The standardization process consists of a re-scaling of the values of a raster using a statistical function specified according to predefined standardization criteria [54], where the scale (rating) is a range of integer values between 1 and 100. In this way, the lowest value is the least representative; hence is the least important. Likewise, the highest value is the most representative. In this research, the logistic function is displayed in Figure 1, where the growth is represented in Figure 1a and the decrease in Figure 1b, and the data that were used to re-scale the values of the variables concerned the wind speed, global solar radiation, slopes, distance to substations, distance to the road network and distance to urban areas, taking into account the limitations expressed in Table 3. These variables have been considered as the most relevant, keeping in mind the review research of Shao et al., who showed the technical criteria used in the location selection of solar and wind power plants; the cited work mentions that most of the published papers consider these criteria and that the effective selection of criteria can effectively prevent poor performance [57].
Furthermore, Figure 2 and Figure 3 show the layers resulting from the preparation of information for the wind and solar power plants, respectively. All the layers that were considered as factors present values between 1 and 100. In this way, the layers considered to be restrictions were added in a single binary layer that presents values of 0 (Restricted) and 1 (Allowed).

2.3. Multicriteria Evaluation

Multicriteria decision methods have been used by researchers to study sustainability issues regarding the energy sectors over the last three decades, showing a significant increasing trend over the last few years [58]. In this sense, several researchers have used techniques such as the AHP and the OWA, which were used in the present work. However, it is important to mention that even though the information and variables of the study for the wind and the solar power plants have been declared together, the following methodology was applied in the same way for both scenarios but individually for the wind and the solar power plant.

2.4. Analytic Hierarchy Process Method

The selection of the most suitable areas to implement renewable energy technologies, such as wind and photovoltaic power plants, comes with a complex problem that has been studied before and solved by the utilization of multicriteria decision methods [59]. In this way, the research of Alami Merrouni et al. solved this problem by using the Analytical Hierarchy Process, which is a mathematical approach that reduces complex decisions to a pairwise comparison [59], making it useful to assess the weight of every variable as follows.
In this process, the comparison and hierarchical evaluation between variables is performed using an “Origin-Destination” matrix. In this sense, the importance of the variables is rated by comparing them to other variables using the values defined on the scale of importance expressed by Saaty, as shown in Table 4.
In this way [60], the weighting made considering the subjective analysis of experts in the field is displayed in Table 5, taking the same considerations for the wind and the solar power plants, where the variables were coded as follows:
A: Wind speed/Global solar radiation.
B: Terrain slope.
C: Distance to urban areas.
D: substations distance.
E: Distance to the road network.
Furthermore, after obtaining the subjective weights of the criteria and considering the inconsistency of the judgments of the evaluator, the method develops a consistency analysis that takes the assessment matrix (matrix M) and multiplies it by the weight matrix results (matrix W), where every value obtained in the resulting matrix R is divided by every weight and summed to obtain the maximum eigenvalue (λmax) of the comparison, as displayed in Equation (1) [61,62]
λ m a x = R 1 W 1 + R 2 W 2 + R j W j
Likewise, the consistency index (CI) is calculated with Equation (2), where n corresponds to the number of alternatives, then the random index (RI) for 5 alternatives corresponds to the value of 1.12, which is obtained from the table expressed by Saaty, the developer of the method in 1980 [61]. Lastly, the consistency ratio (CR) is calculated with Equation (3), where the result should not exceed a value of 0.1 (10%) to ensure the consistency of the evaluation and a correct assessment [63].
C I = λ m a x n n 1
      C R = C I R I

2.5. Ordered Weight Average Method (OWA)

The integrated GIS-based method allows us to perform a risk analysis by using the OWA approach, which has been used previously in the selection of the best locations for the implementation of renewable energy solutions [64]. Hence, the OWA method was applied to calculate the multicriteria map for wind and photovoltaic energy to prioritize locations for electricity generation in the Galapagos Islands, following the procedure detailed in the work of Mokarram et al. [65]. In this work, Equation (4) is used to apply the OWA method.
O W A   Z j k = i = 1 n w i V i j k             i 1 , 2 , , n
where Z j k is the tensor for the multicriteria raster, w i are the weights for the factors analyzed in Table 6 and satisfies Equation (5), n = 5 , V i j k are the factors standardized with values between 1 and 100 and j and k are the rows and columns of each raster analyzed.
i = 1 n w i = 1

2.6. Selection of the Best Location

The MCDM assigns an integer value between 1 and 100 to each pixel. In the case of the Islands, there are no locations that meet 100% of the criteria evaluated. The allocation for the study area was given on a scale of 14% to 88% of compliance with the criteria evaluated for the wind power plants and a scale of 33% to 89% for the solar power plants. This assignment allows us to have a more flexible choice of category ranges with some precision, meaning that the best results are obtained with the least possible risk. In this way, all pixels classified in the range of 85% to 88% by the MCDM were considered suitable locations. Furthermore, from these pixels, the surfaces that have at least three adjacent pixels and that are outside the restricted areas were selected.

2.7. Development of Implementation

The photovoltaic capacity depends on the usable area where the panels can be installed. Based on the document of the Government of Chile prepared by the GIZ, “Guide for the initial evaluation of buildings for the installation of photovoltaic systems”, the methodologies for the proper functioning of low-generation photovoltaic systems are proposed, and the reference is taken from the application of photovoltaic panels in the city of Puerto Montt [66]. On the other hand, the information on the Galapagos wind power plants is based on a linear extrapolation carried out to determine the capacity (MW) that can be installed in an area of 200 × 200 square meters. The base information used to build the linear regression is presented in Table 6.
On the other hand [66], for the wind energy projects, a field validation was performed. Where the best-suited areas obtained by the GIS-MCDM were divided into polygons to be assessed; in this way, the process used satellite imaging, cartographic information of roads, urban areas distribution and the Eolic atlas of Ecuador [67], which includes the wind speed and performance factor. Even more, it was considered a potential wind power electric generator model for a 2 MW generator developed by the IIGE [68]. Furthermore, the field evaluation of the road status, communication signals, GPS geographical data, type of vegetation, slopes, ground use, evidence of bird transit and rugosity of the terrain consisted of a quantitative assessment from 1 (worst) to 10 (best)

3. Results and Discussion

The assessment of the best site for the implementation of wind and solar power plants on the Galapagos Islands is a worldwide topic of interest since the transformation to zero-carbon politics allows for preserving the human heritage that this natural location represents for tourists, researchers and wildlife. In this sense, the evaluation of the best locations to implement wind farms and solar panels has been investigated by using mathematical and informatic means; hence, the results are presented individually for each renewable alternative.

3.1. AHP Method Results

The Analytic Hierarchical Process was developed by experts that assessed the criteria for both wind and solar projects. In this sense, regarding Table 5, the method followed the normalization matrix expressed in Table 7, allowing us to obtain the weight of every criterion evaluated in Table 8, showing that the most important criteria are the distances to the substation and urban area. This assessment has been accepted since the subject considerations of the experts on energy and conservation consider that the interference between the distances to provide electricity and the natural fields should be as minimum as possible.
On the other hand, the consistency of the assessment has been evaluated in Table 9, where the maximum eigenvalue is obtained, and the consistency ratio is calculated in Table 10. In this sense, the value of CR is lower than 0.1, meaning that the judgment of the experts regarding the priorities of the criteria has an acceptable consistency.

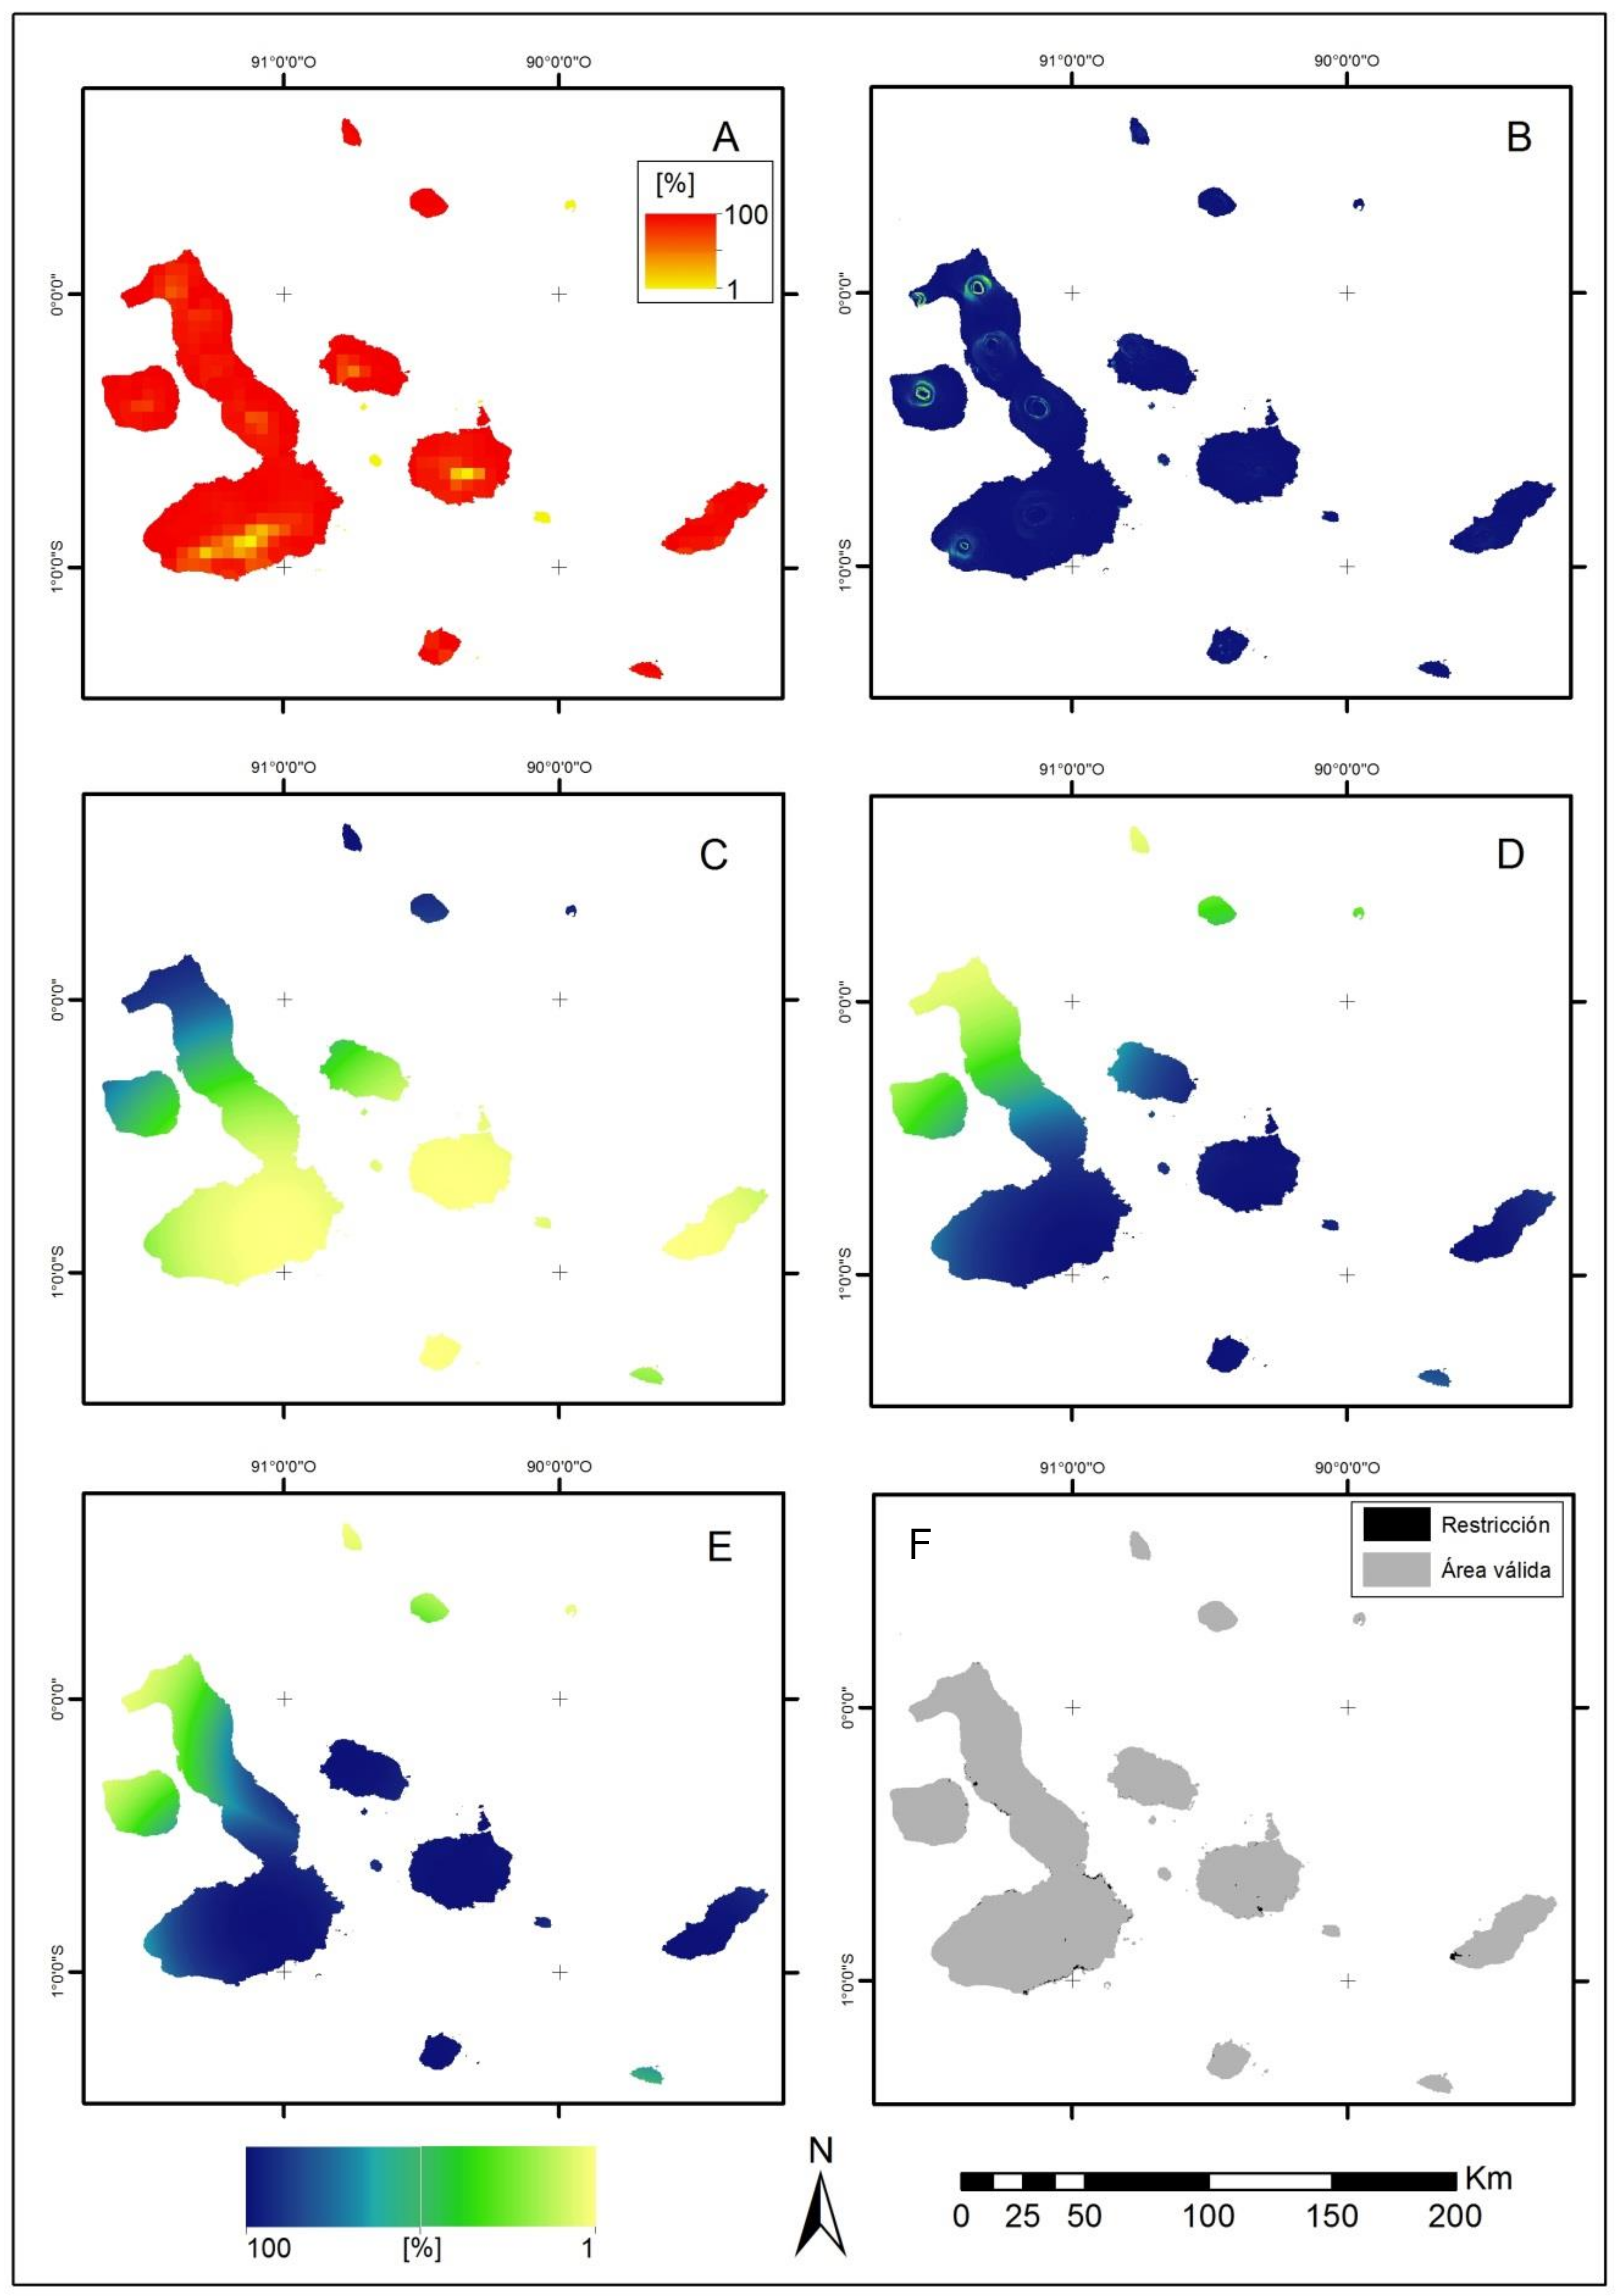
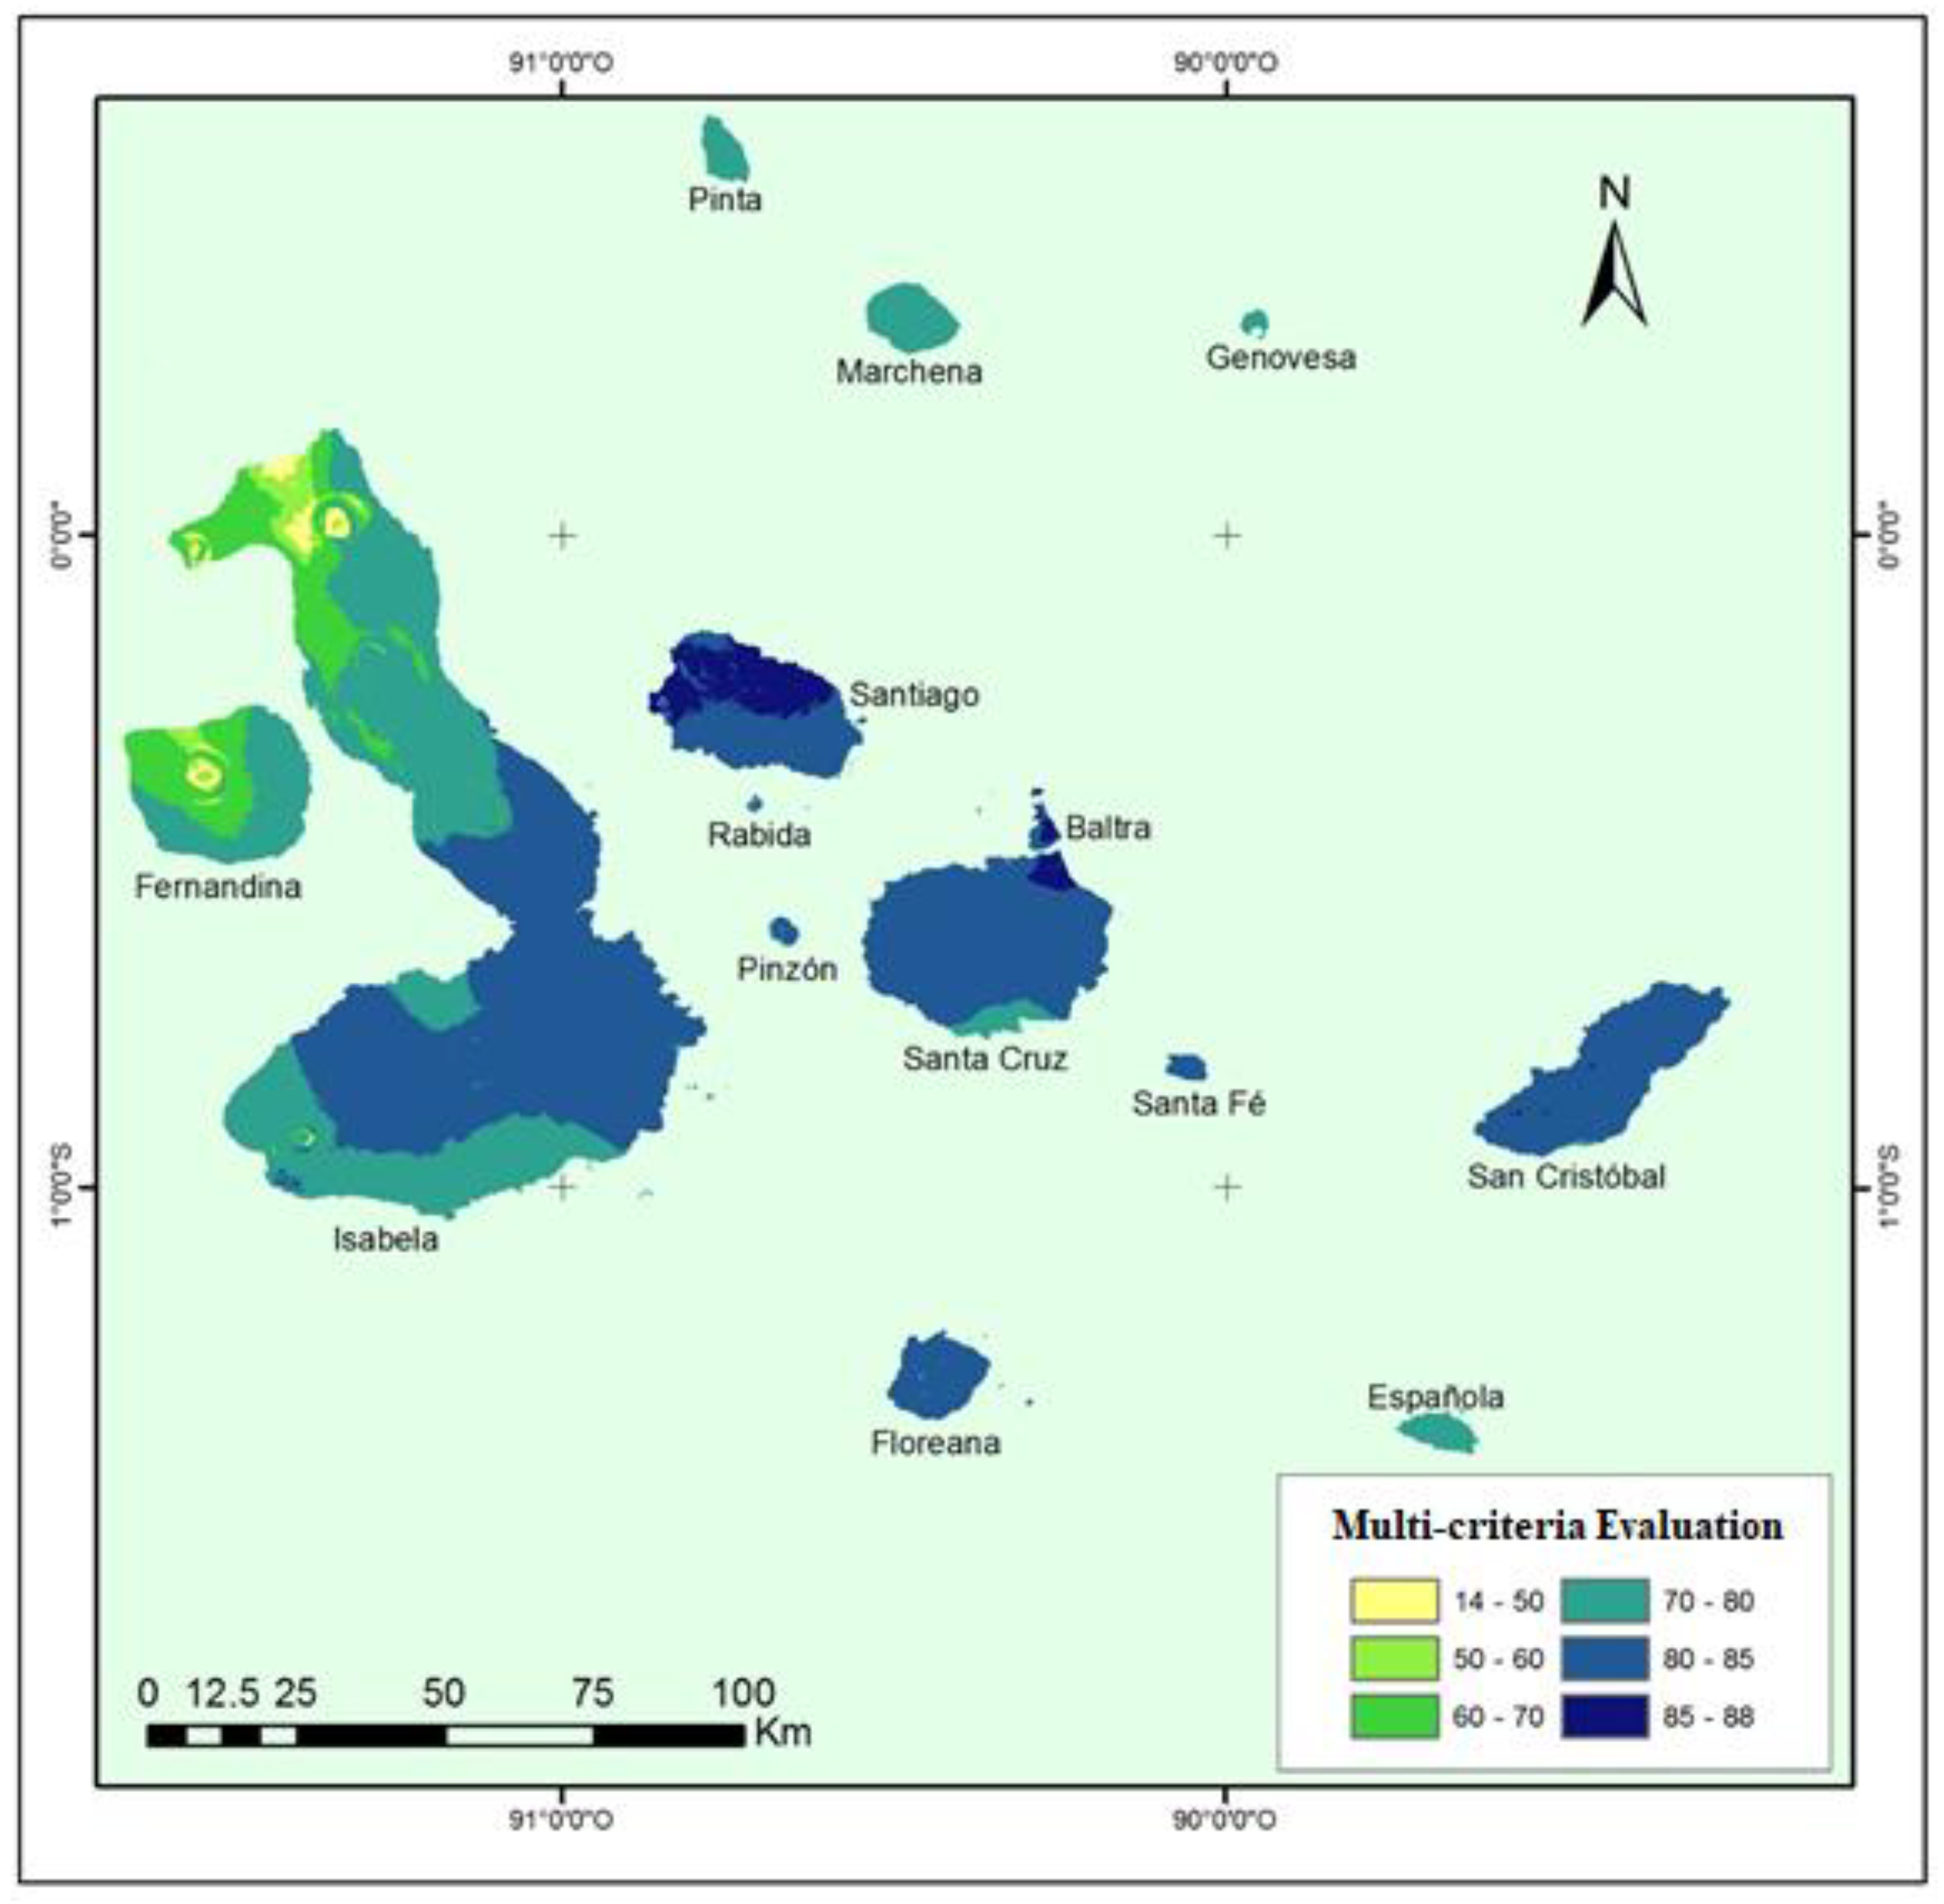
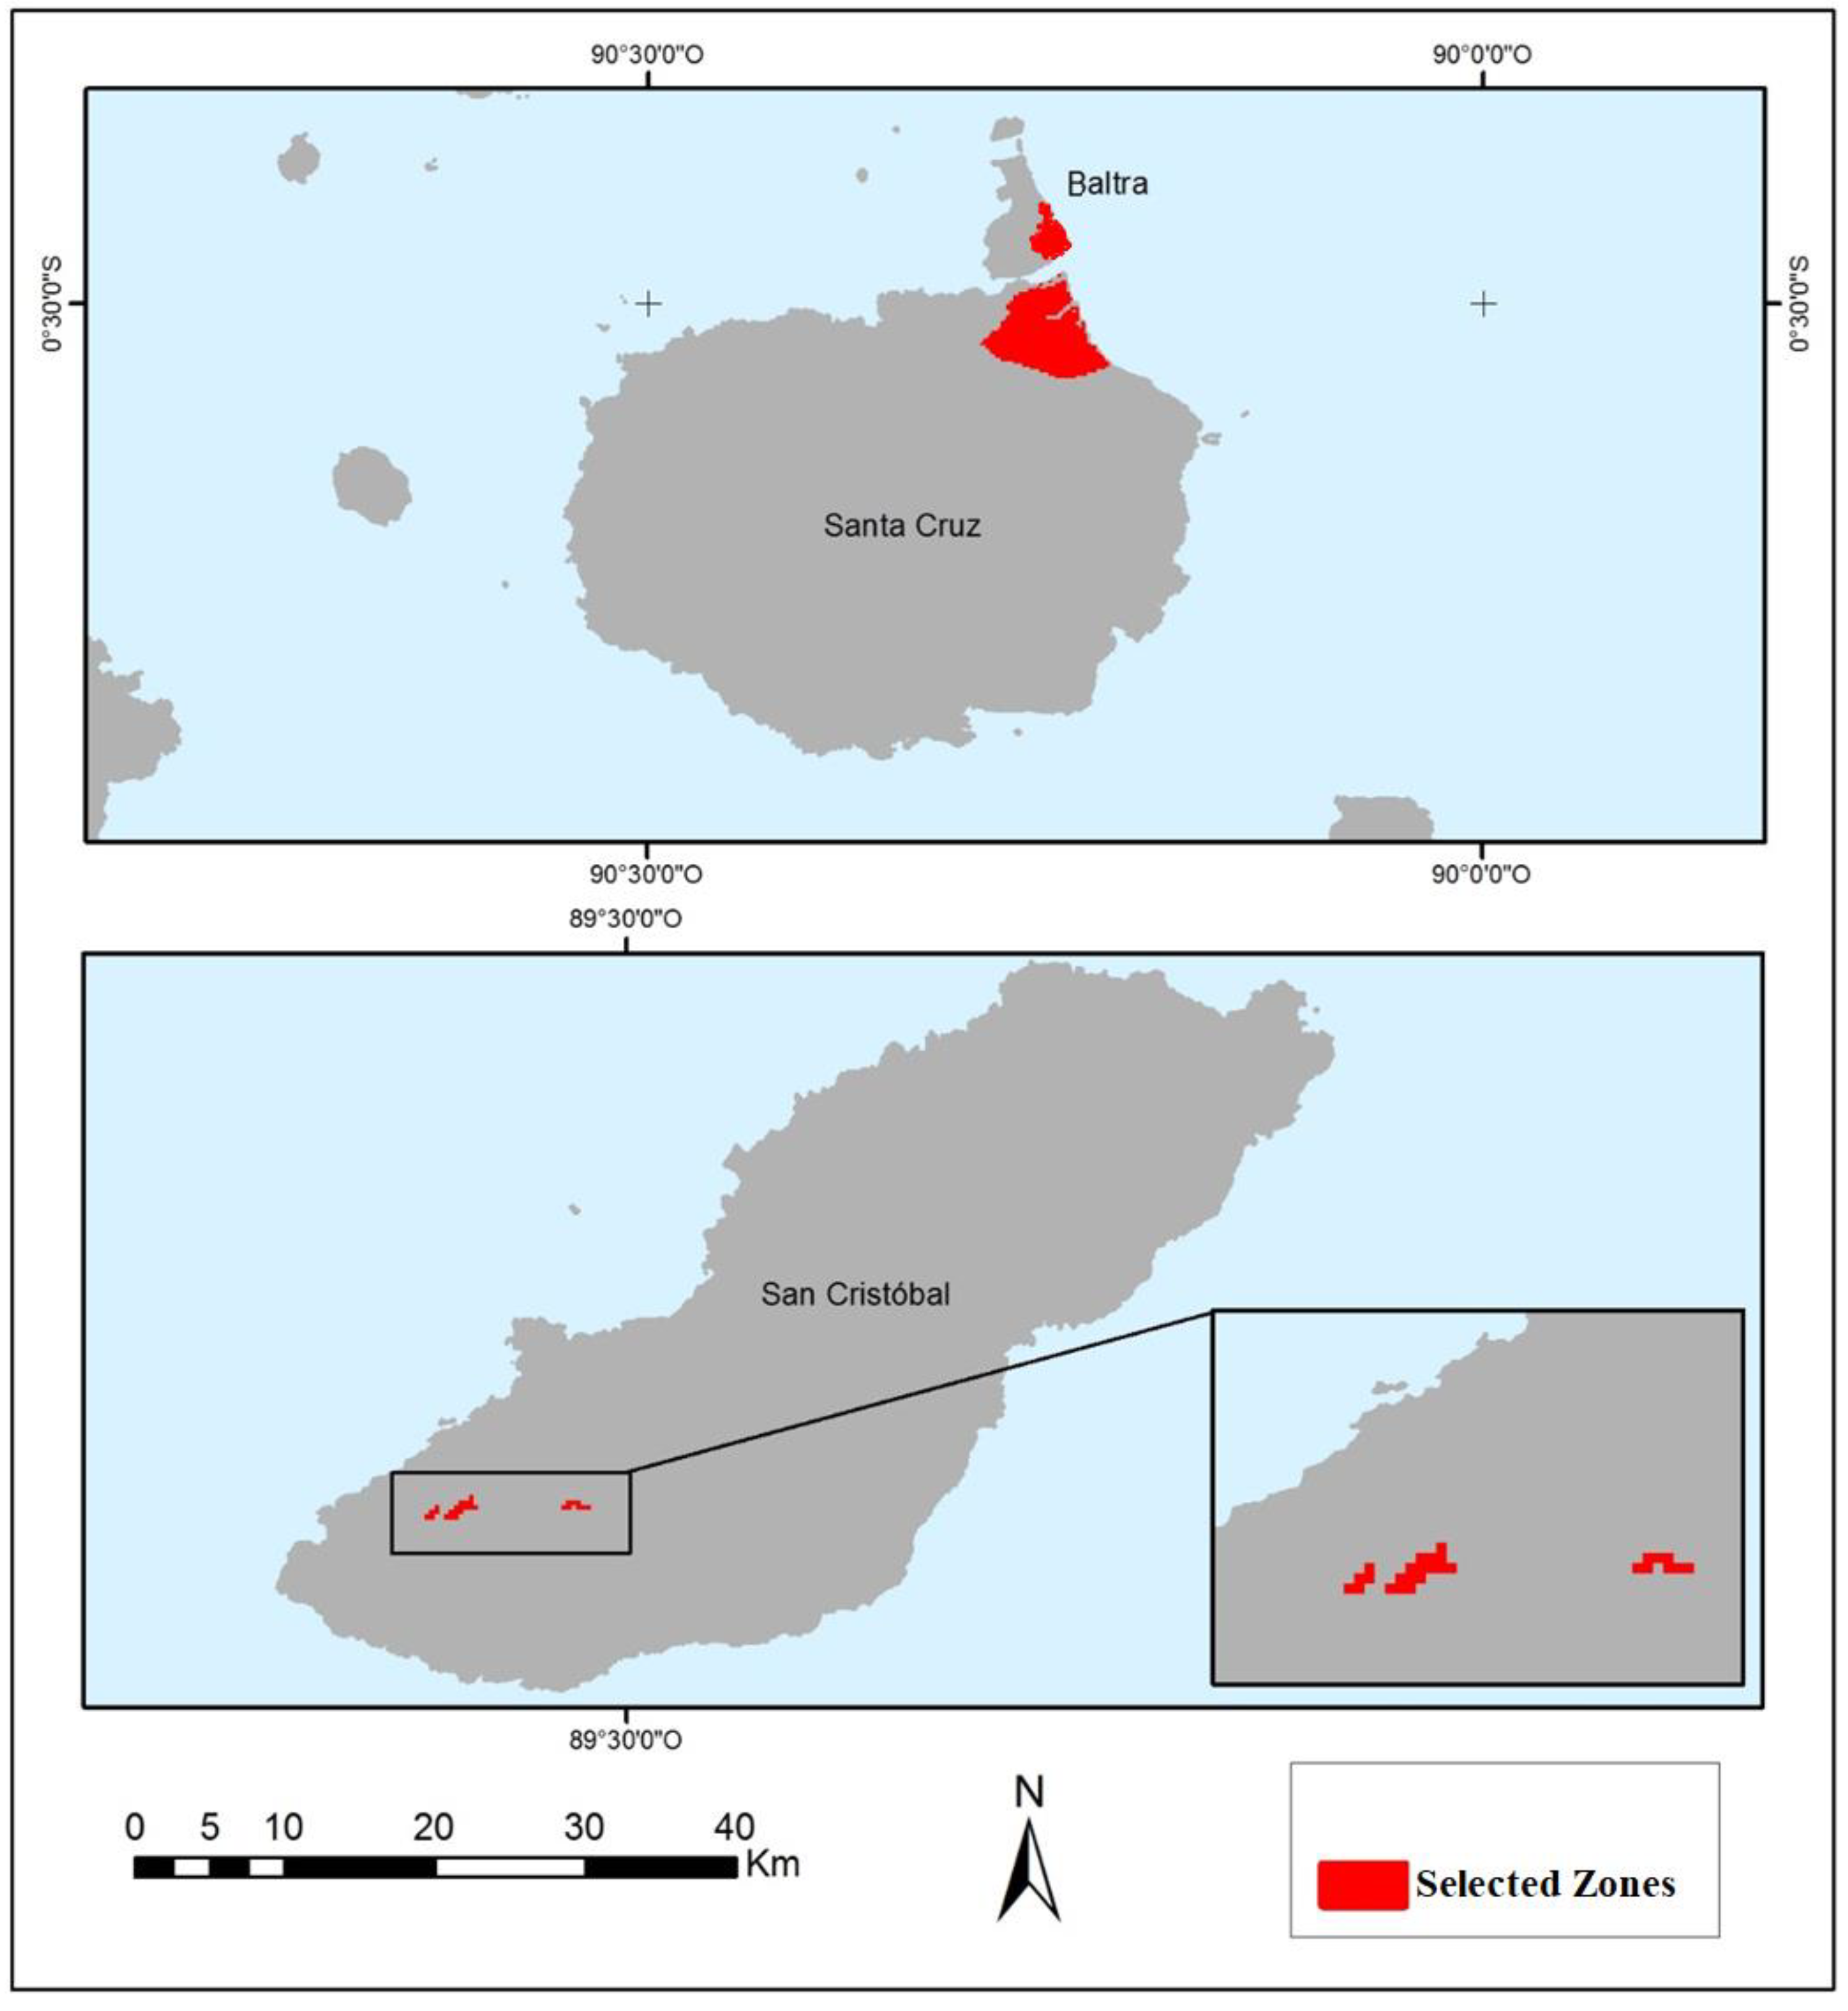
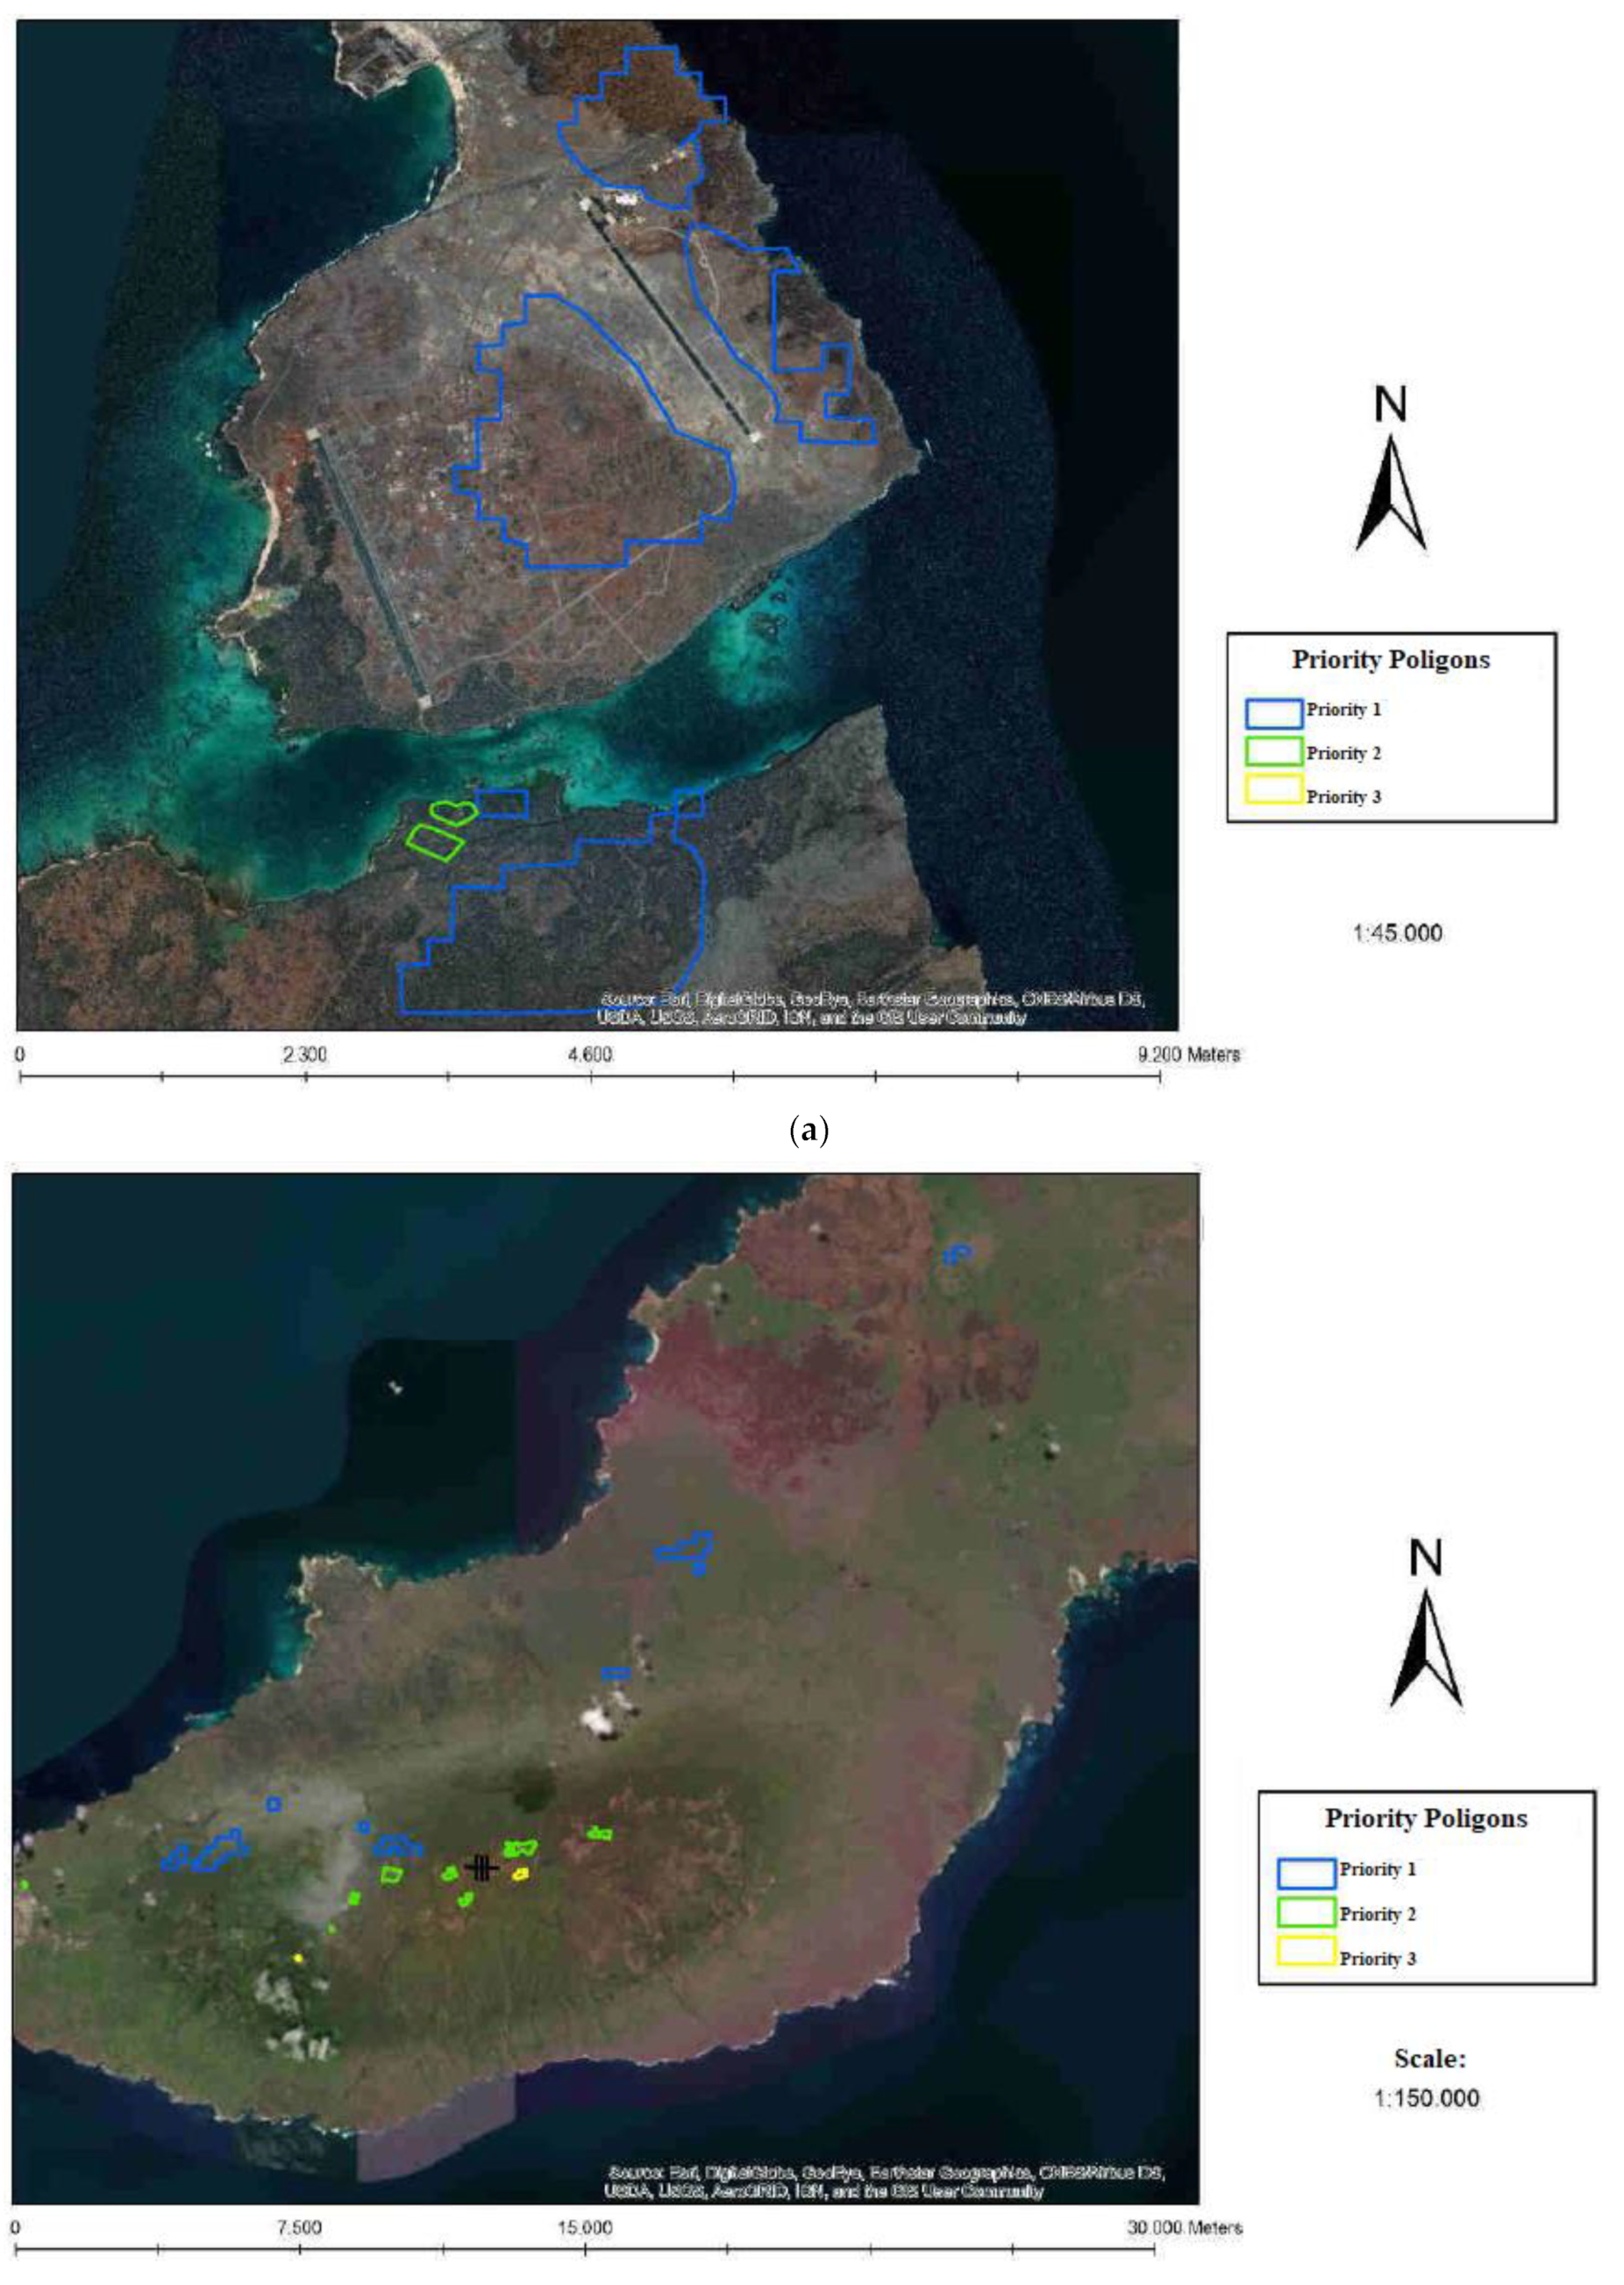
3.2. Best Locations for Wind Power Plants Based on MCDM

The multicriteria evaluation according to the OWA method reflects that the locations with the best classification are located mainly on the islands of Isabela, Santiago, Baltra, Santa Cruz and San Cristóbal. However, Isabela Island is ruled out for having a high risk of volcanic hazards; Santiago Island is discarded since it does not have a representative population occupation area, and it is an island with a high degree of endemic species. In this way, the remaining islands have areas whose MCDM assessment is between 85% and 88% compliance, which is considered the highest score results from the analysis, as presented in Figure 4.
In this way, regarding the GIS-Based MCDM for the selection of wind power plant implementation sites, the literature has classified the sensitivity of the selection into five levels, which are very low, low, middle, high and very high [26,29]. In this sense, the research of Arca and Keskin Citiroglu used the GIS-AHP method to assess the best locations for the application of wind power plants in Turkey, resulting in a maximum fraction of 45.22%, which corresponds to a middle sensitivity [26]. Therefore, the result of the present research shows that the sensitivity of the AHP-OWA approach has relevant results since it reaches areas with compliance of 85% to 88%, which can be cataloged as high. In this way, Figure 5 shows the best locations for wind power plants.
The potential areas that can be used for wind power plants are small compared to all the island’s extensions; however, this result shows the locations that are considered the best, which are San Cristobal, Santa Cruz and Baltra. In this way, the same issue was presented by Xu et al., who made the location selection of wind farms in the region of Wafandian-China, finding that the most favorable areas for the application of Eolic energy plants were 30.2% of the total candidate grid, but the best suitable grids represent a portion of 3.36% [48]. Even more, the research of Gavériaux et al. showed that for offshore applications of wind power plants, the MCDM–GIS approach managed to highlight the most suitable zones even though they used other criteria [69]. Therefore, it is feasible to assume that these small areas are the best among all the suitable options, and even more, it has also been proved that healthy exploitation of the wind power can be reached by using effective decision tools with suitable assessment location selection [48].

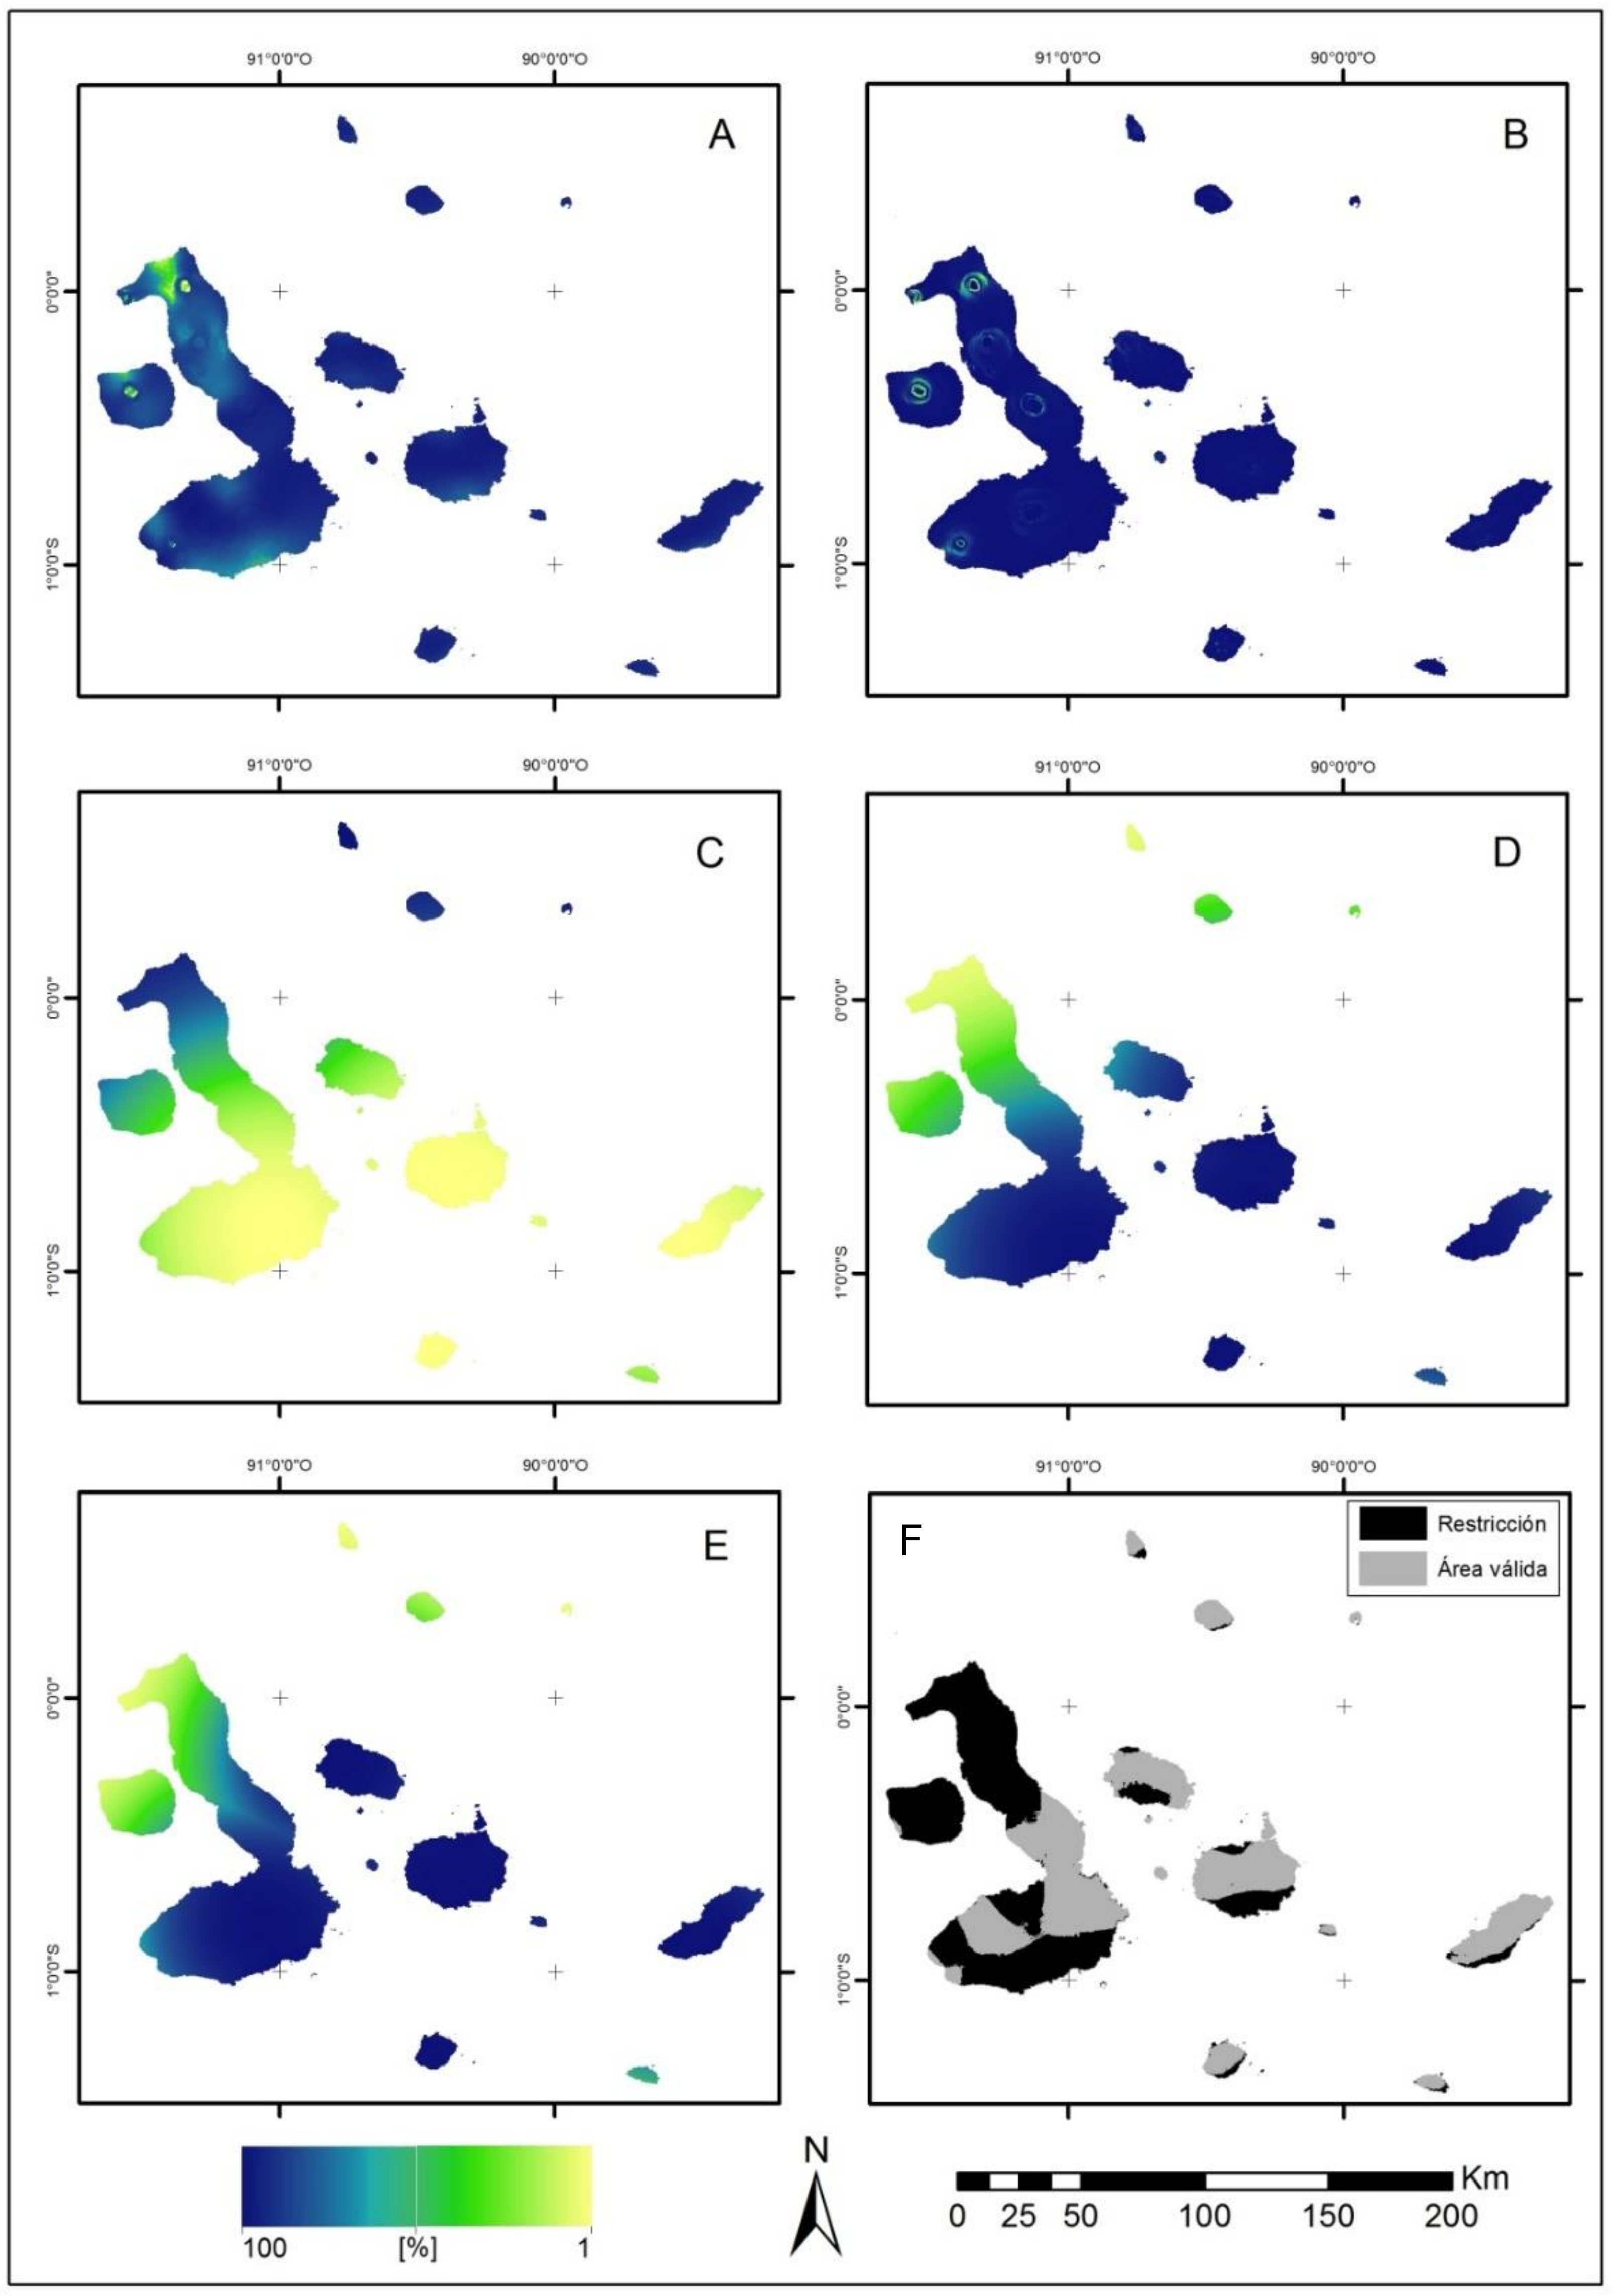
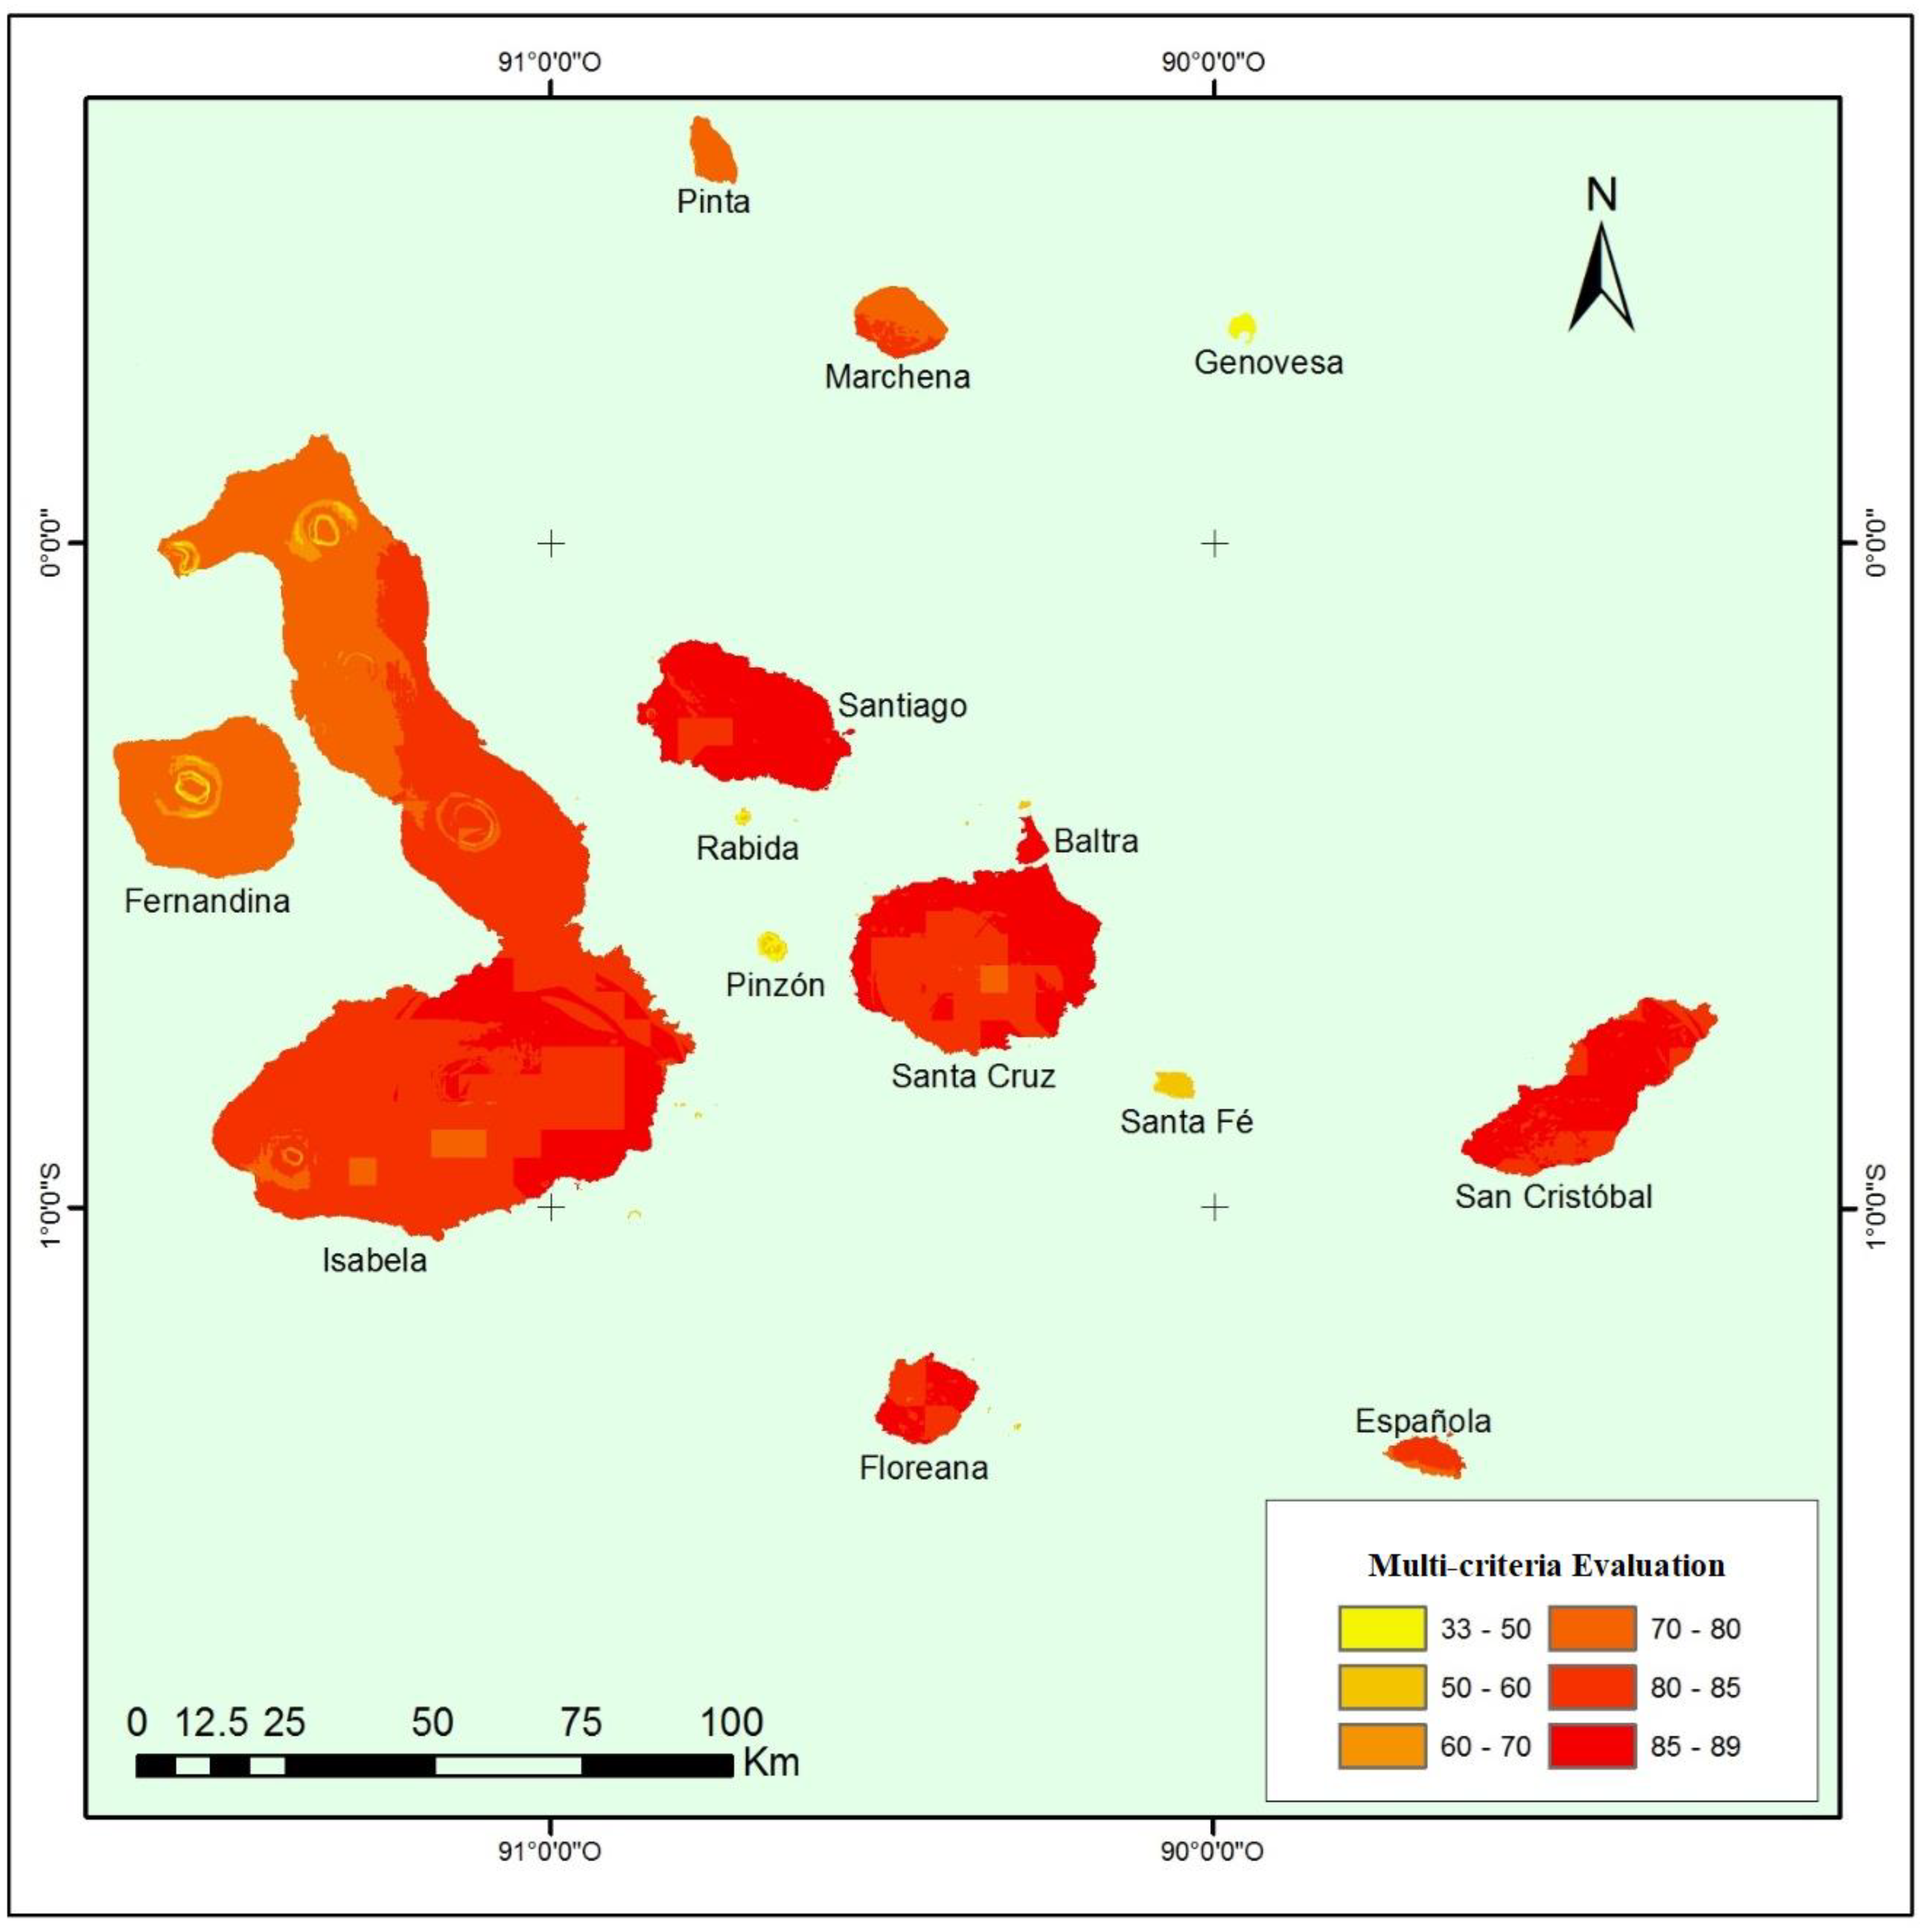
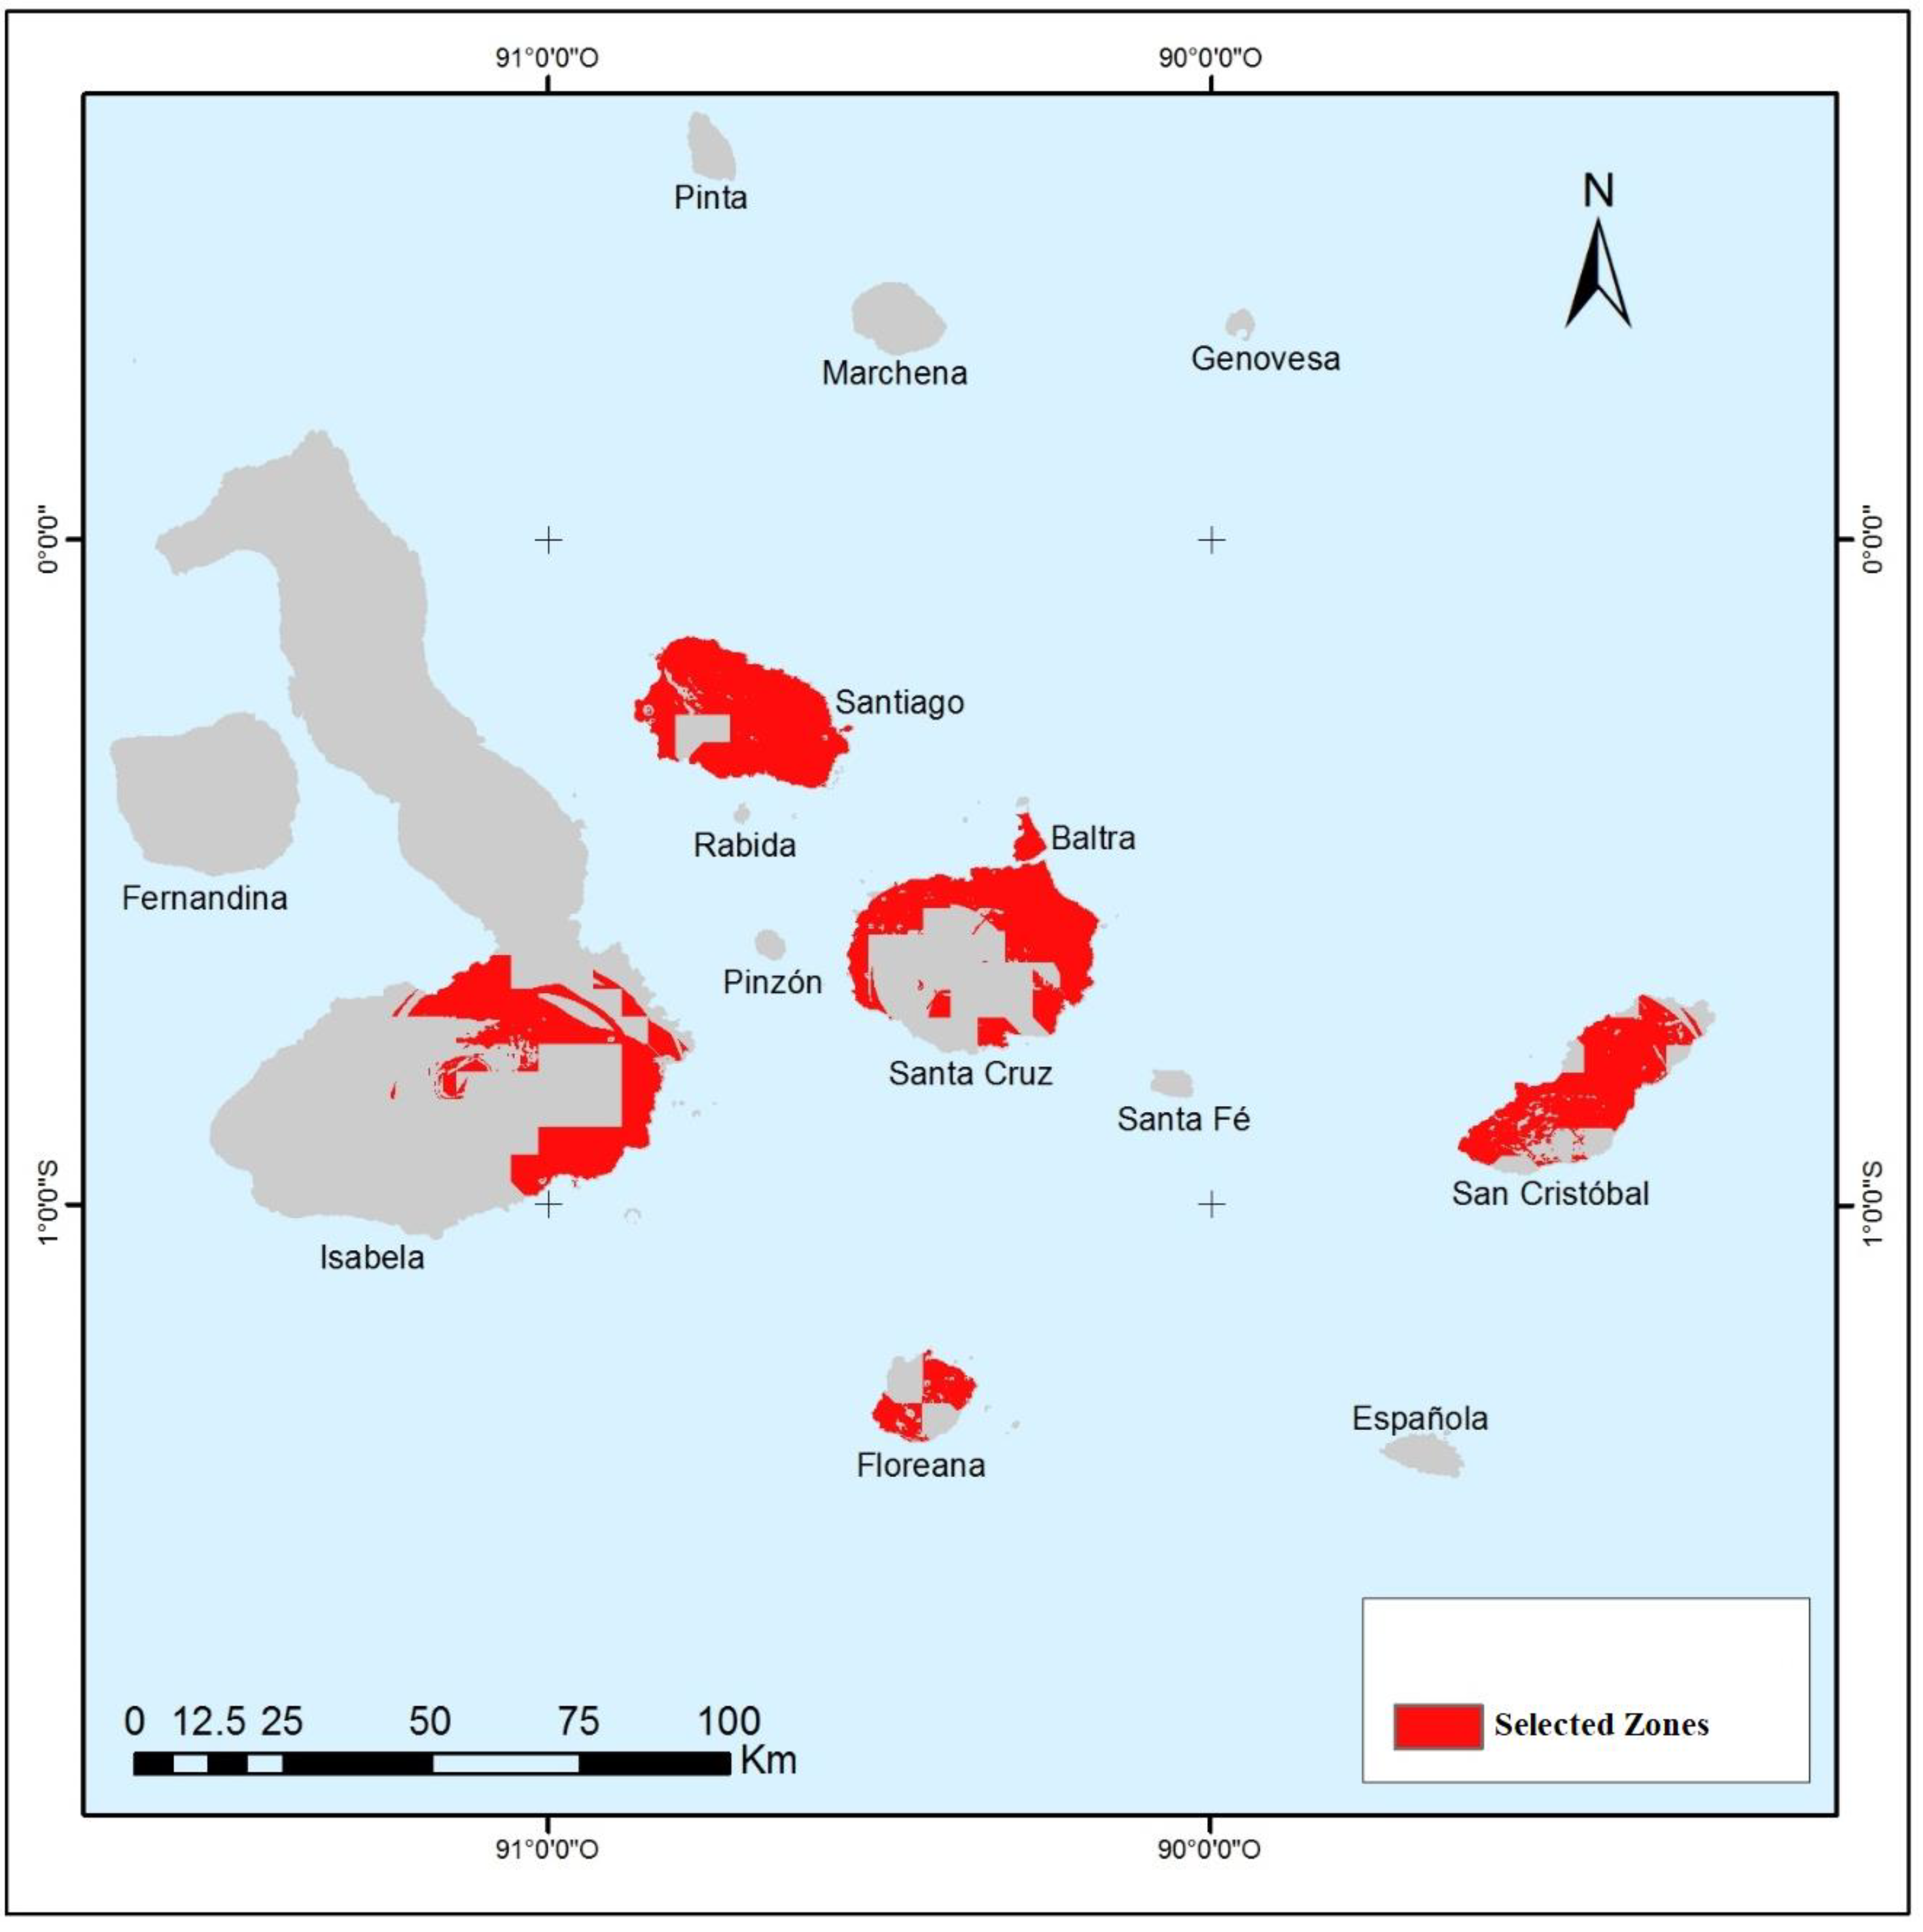
3.3. Best Locations for Solar Plants Based on MCDM

The preselection of locations was concentrated in the areas whose MCDM assessment was greater than 85% and did not coincide with the restricted areas but were close to urban or populated areas. In this way, the characteristics of each area were analyzed on a timely basis, where Figure 6 shows a map of the multicriteria evaluation without the restricted areas. In this sense, it is observed that the areas with the highest population concentration are the ones that are eliminated from the analysis.
Furthermore, the multicriteria evaluation according to the OWA method reflects that the locations with the best classification are located mainly on the islands of Santiago, Floreana, Baltra, Isabela, Santa Cruz and San Cristóbal, where the first is discarded because it has a concentration of flora and fauna endemic species, they also have a very low or non-existent population concentration, meaning that the investment is not justified. On the other hand, the Floreana, Baltra, Isabela, Santa Cruz and San Cristóbal Islands are the best options for the location of solar power plants. Hence, these Islands have areas whose MCDM assessment is between 85% and 89% compliance, considered the highest resulting scores from the analysis.
In this way, comparing both scenarios, the results show that in the case of the wind power plants, high compliance between 85% and 88% is available on small portions of Santa Cruz, San Cristobal, Baltra and a fragment of Santiago. However, in the case of the solar power plants, great areas are suitable on the same Islands; even more, all the Island of Baltra, almost every part of Santiago and San Cristobal, nearly half of Floreana and some big areas in Isabela host high compliance for the application of solar panels, meaning that the solar potential of the Islands is greater than the wind potential. Furthermore, the study of Giamalaki and Tsoutsos considered the solar potential of the Mediterranean zone and evaluated the implementation of photovoltaic panels on the Regional Unit of Rethymno on the Isle of Crete by GIS-Based and AHP methods, where the results showed that there are considerable areas with a middle sensitivity and just a few areas with high sensitivity [47]. In this sense, the results of the study on the Galapagos Islands show that the potential of implementation of solar plants in this emblematic location is important, giving the natural opportunity to manage alternative energies. Likewise, Figure 7 shows the location of the areas with the best rating. Furthermore, the stability of the method is compared with the research of Tercan et al., that used the GIS method with the AHP method to weigh linear combination and inverse distance weighting approaches, finding an extensive percentage area with high and moderate suitability for solar energy plants [70], showing that the MCDM-GIS method can be trusted for the evaluation of solar energy plant location selection.
In this way, even though the islands have an interesting potential to use the radiation from the sun, the wind potential is not that high. However, not considering Santiago Island for the aforementioned reasons, San Cristobal Island was shown to be suitable for solar energy plants along nearly all the territory and a few parts of it for wind power plants. In the same way, Santa Cruz Island has a very good potential for solar energy power along with its shores, and a small part (but large compared to San Cristobal Island) can host wind farm installations. Even more, Santa Cruz Island already has a photovoltaic installation, which shows it that can be expanded to fulfill the need of the zero-carbon project. Likewise, dual research of solar–wind power has been performed in Turkey by Koc et al., where the selection of the best locations by GIS and AHP methods showed that even the areas for solar potential constitute an area of 524.5 km2 and for the wind farms 147.2 km2, the common areas for both alternatives represent 48.1 km2 [49]. In this way, a similar phenomenon has been found in the present research, where the solar potential is greater than the wind potential, but still, some areas can manage both alternatives.

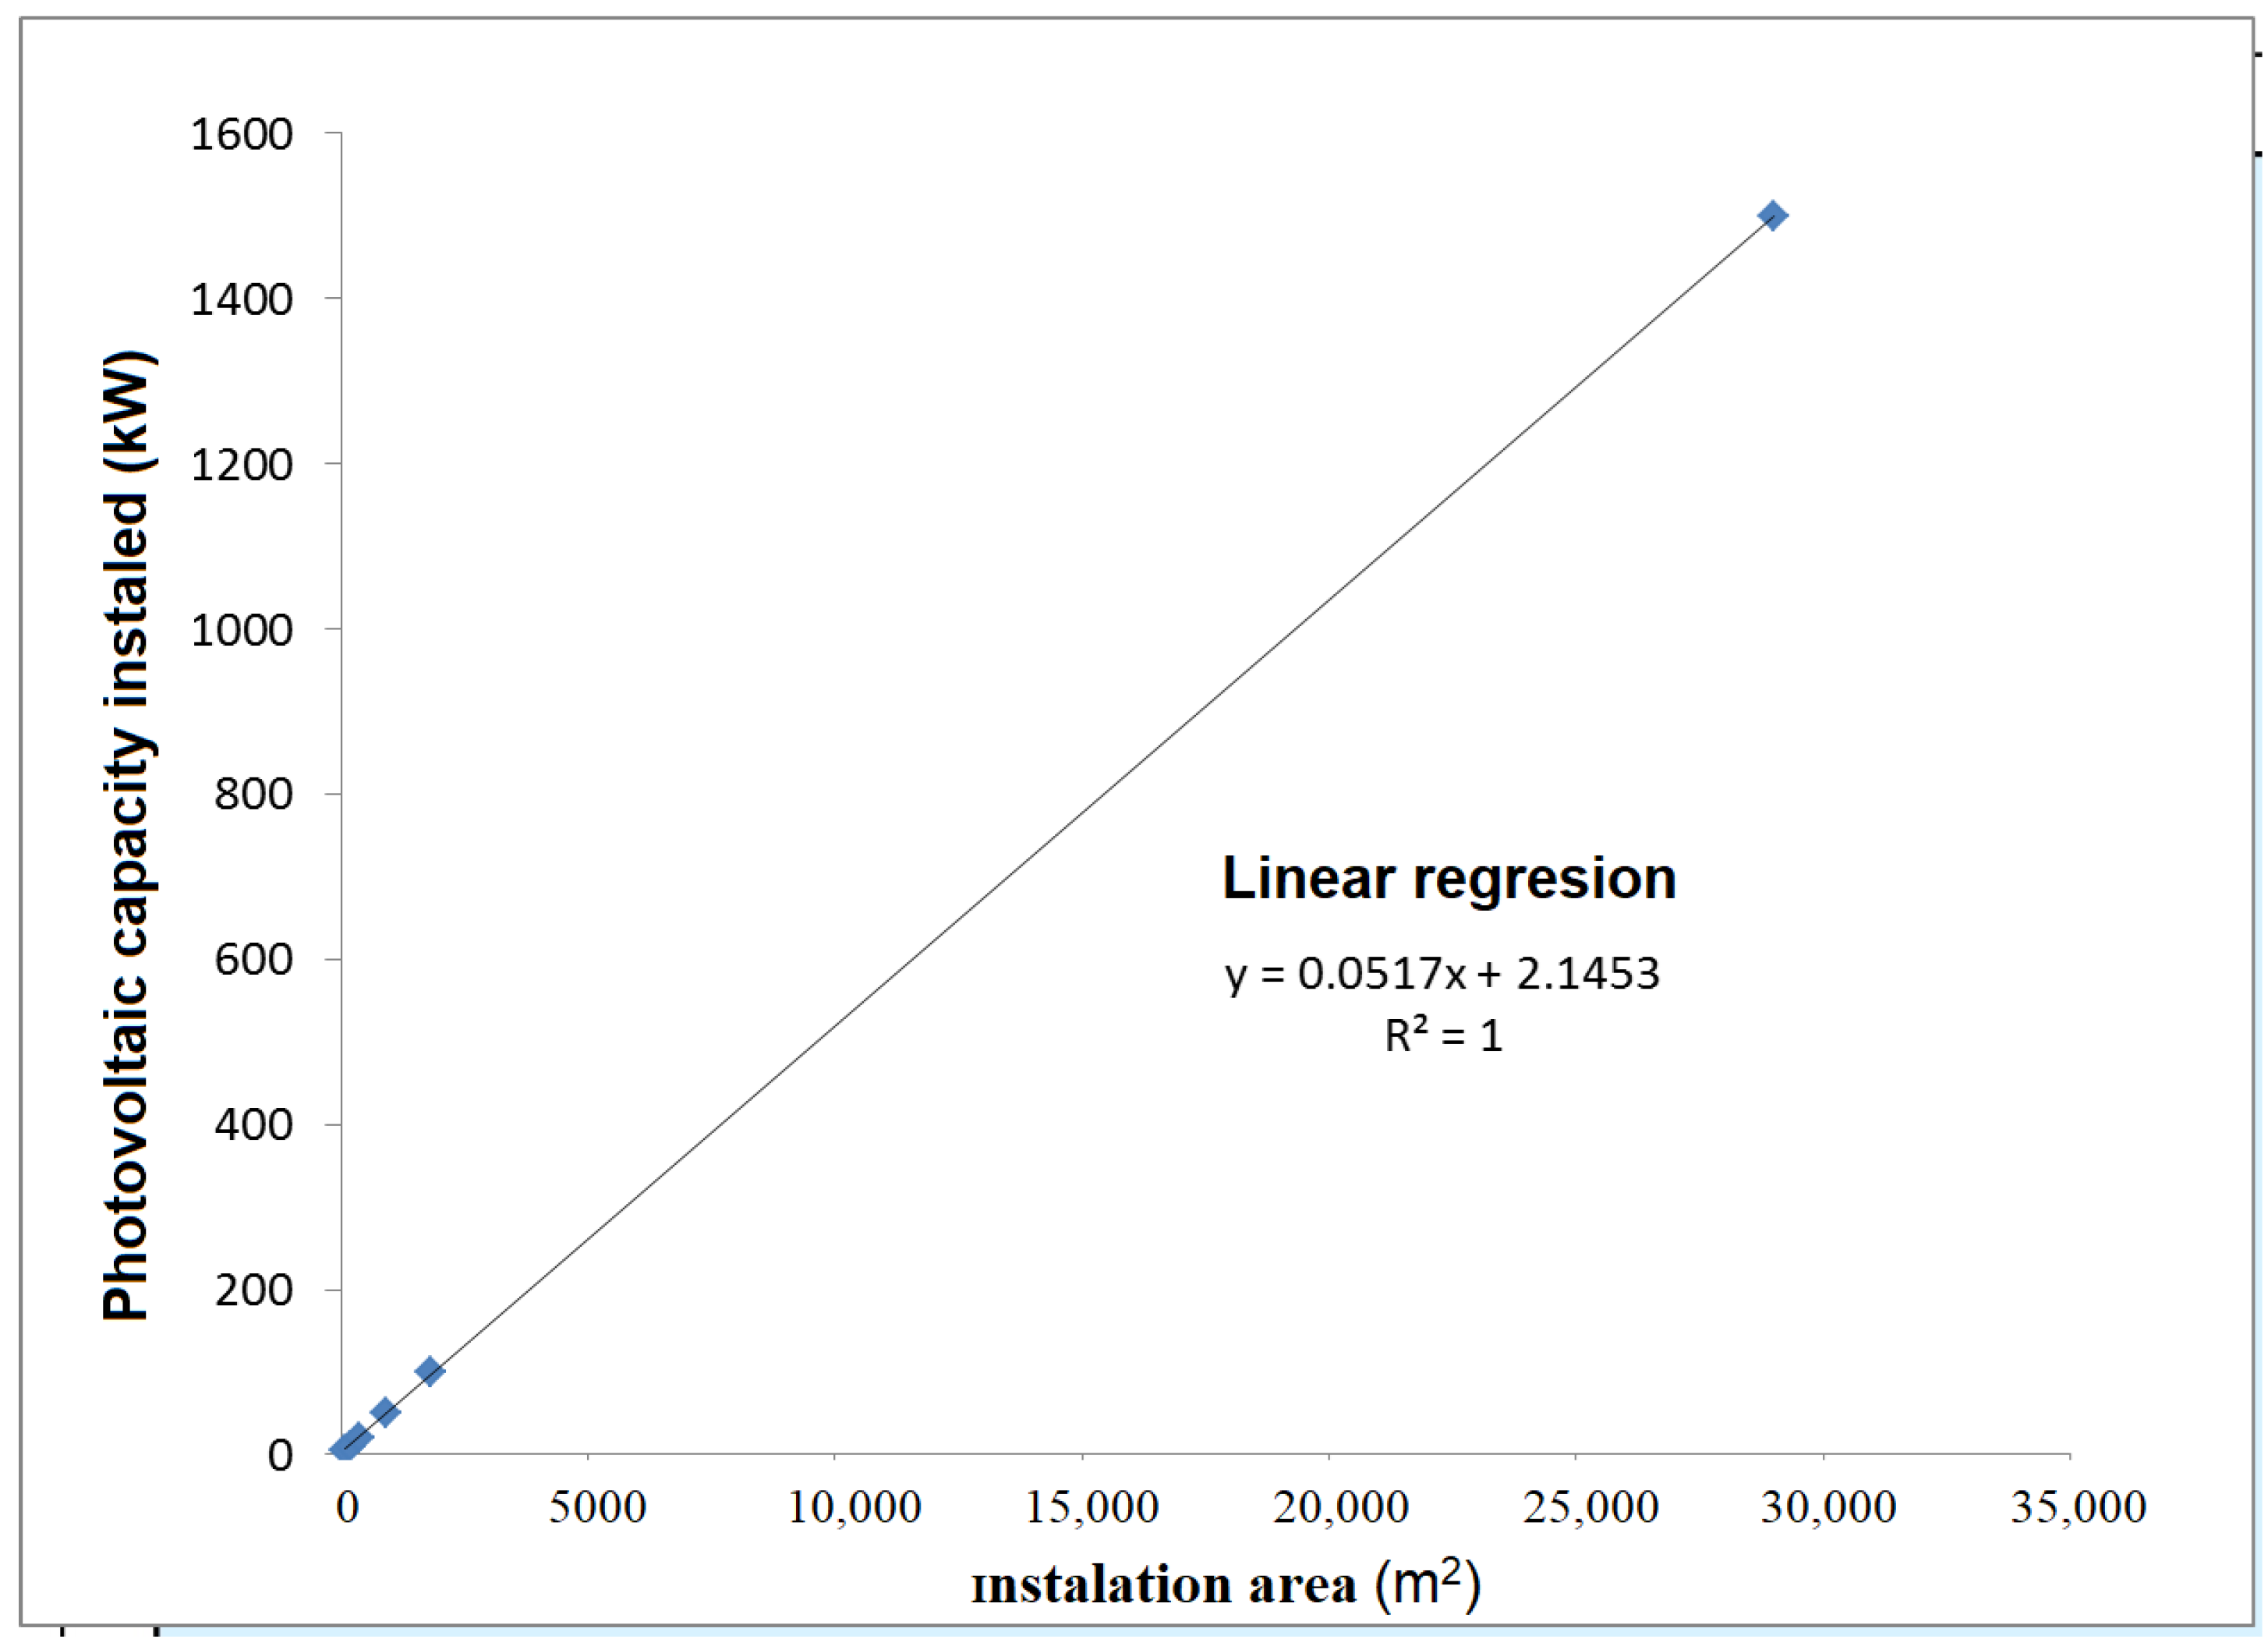
3.4. Energetic Capacity for Photovoltaic Power

Based on the reference data from the GIZ and the Puerto Ayora photovoltaic park in Galapagos, a linear regression was performed to project the installable capacity in an area of 40,000 m2. In the following Figure 8, the regression shows that the installable capacity for the study area is 2.1 MW. In this way, based on the extrapolation presented for five prioritized pixels in each of the Galapagos Islands, they would mean 10.5 (MW) installable. Therefore, the number of pixels for San Cristóbal, Santa Cruz, Balta and Isabela exceeds 20 pixels in the vicinity of the towns, where the capacity would exceed the electricity demand of each Island. In the case of Floreana Island, one pixel exceeds its entire demand for electrical energy, confirming that the GIS-based techniques are useful in the identification of high irradiance solar locations for solar power plants [30]. In this sense, solar parks of 10 (MW) are very feasible to build in the vicinity of the populations of each Island. In this way, the photovoltaic capacity analyzed by GIS-Based and MCDM has shown important potential all over the region; for example, the research of Rios and Duarte, which studied a large-scale implementation of photovoltaic power plants in all the Peruvian territory, showing that the solar potential can reach even 69 times the energy already implemented in the country [61]. Hence, it is demonstrated that the methods used can exploit the potential of renewable sources to fulfill and even exceed the needs of the population, making it feasible to accomplish a zero-carbon policy.

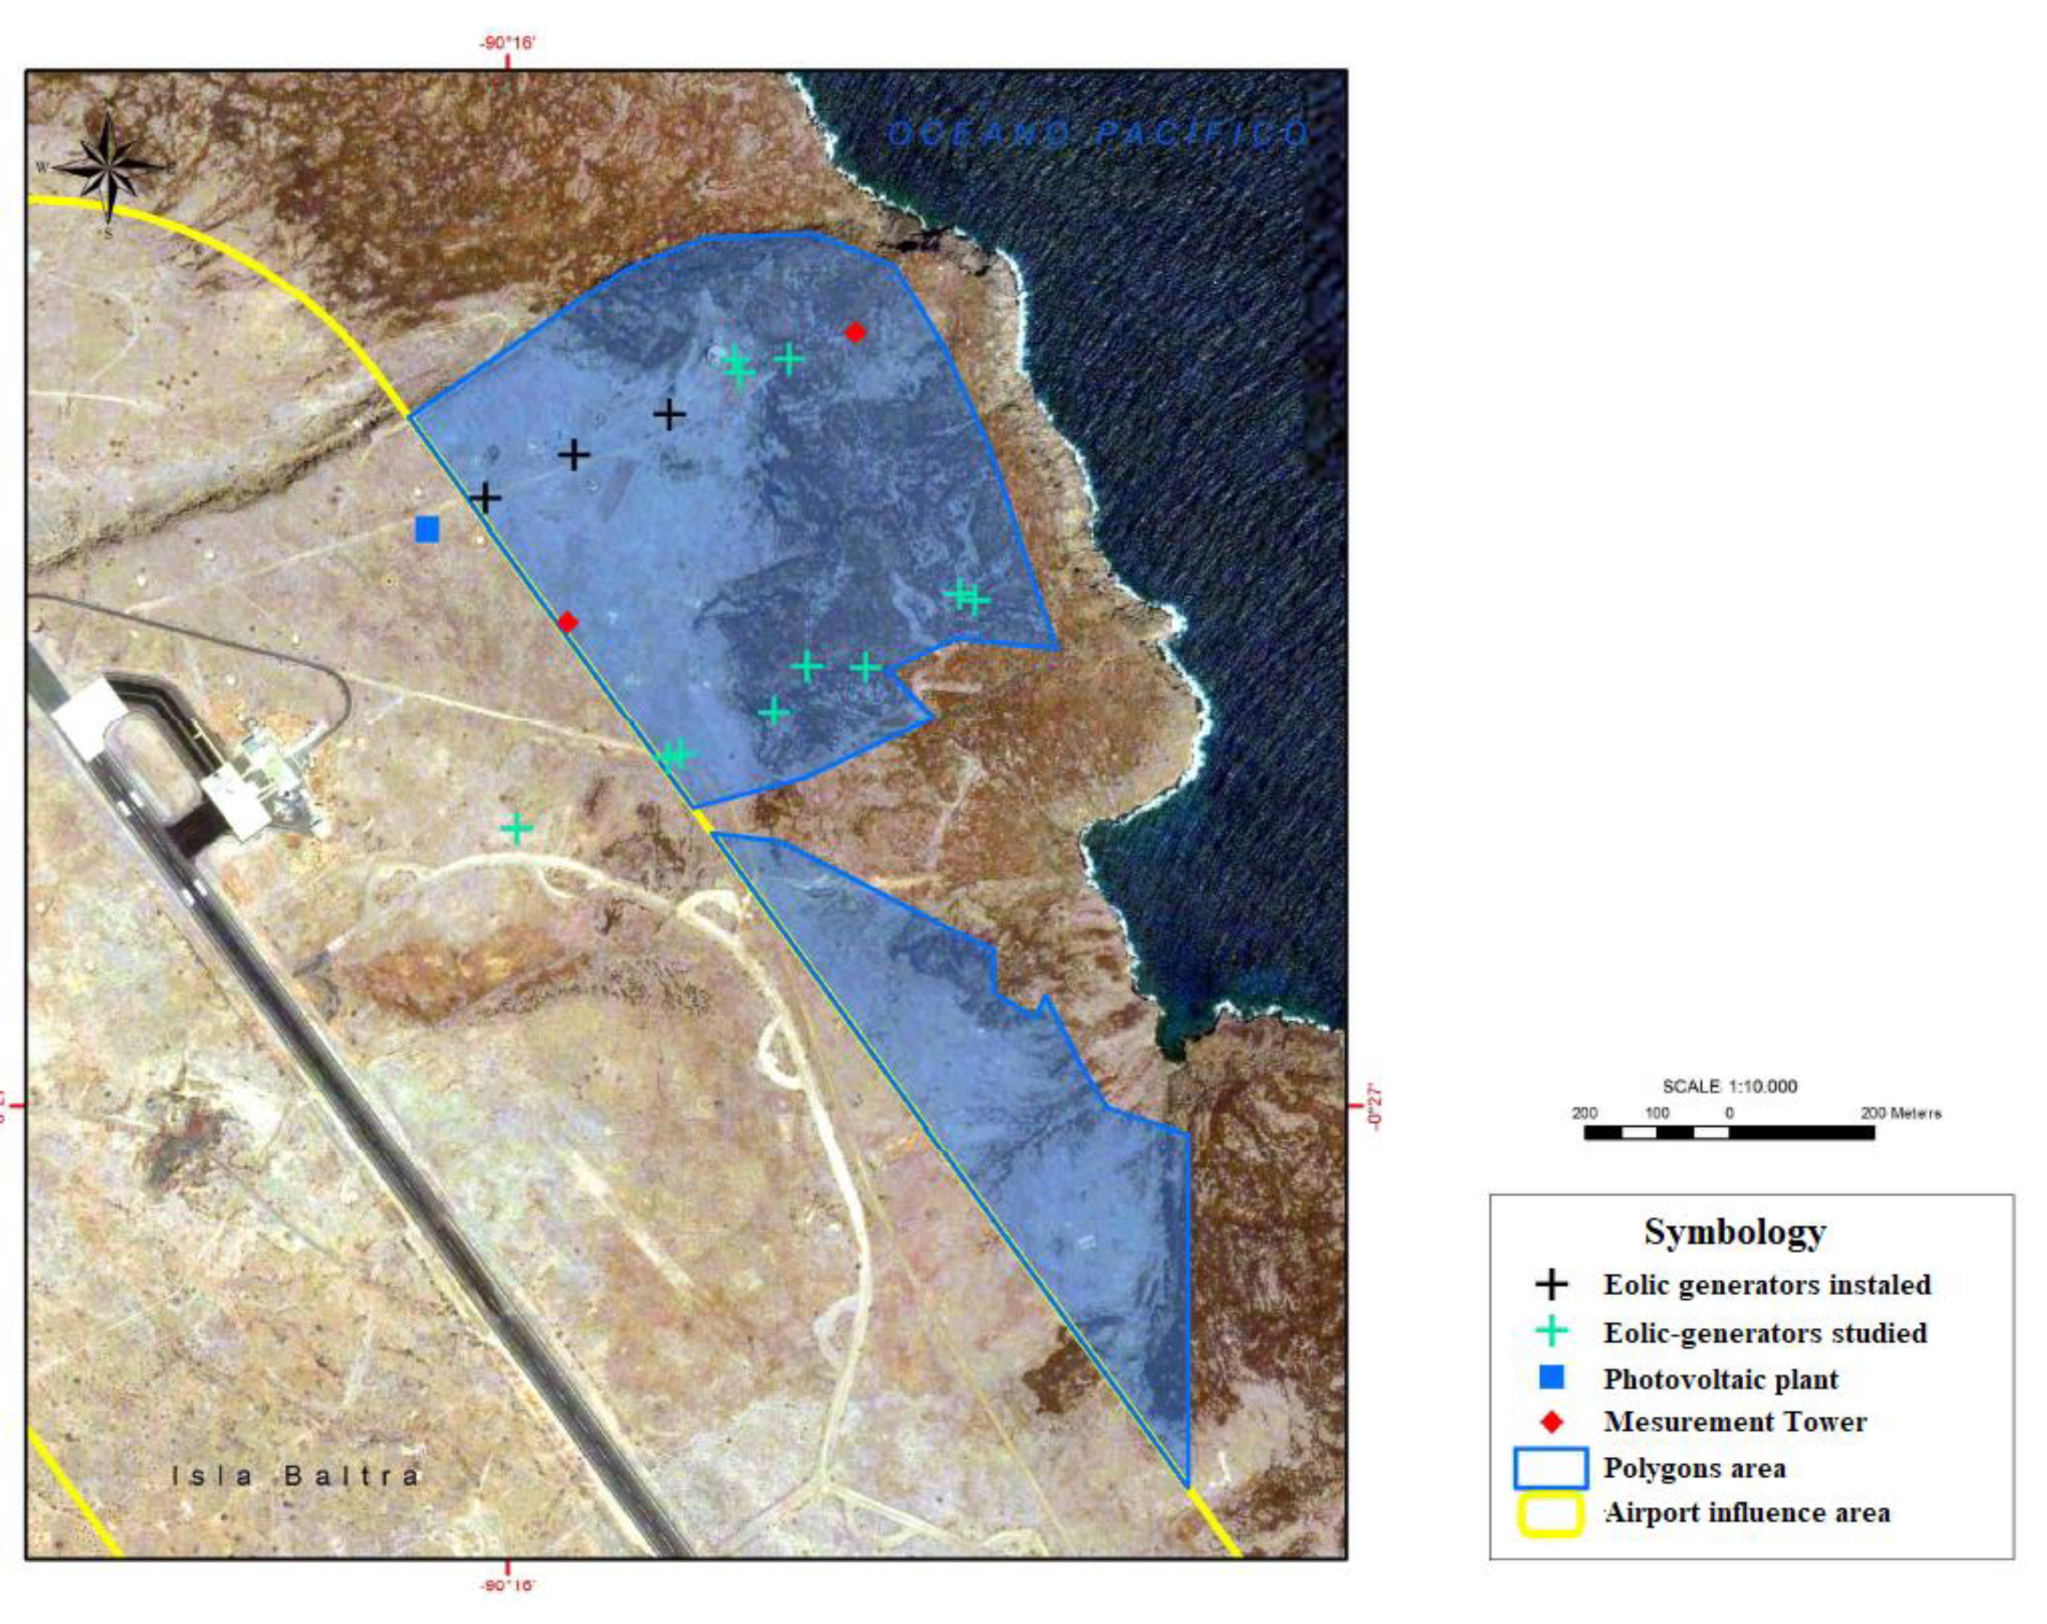
3.5. Eolic Locations Validation

Regarding the possible locations of implementation for wind power plants on the Galapagos Islands, the GIS-MCDM evaluation determined that the best-suited locations considered are the Islands of Baltra, Santa Cruz and San Cristobal. In this sense, taking into consideration environmental factors, such as the reported deaths of bats and birds due to the blades of the turbines [23], the possible locations of implementation were reduced, as shown in Figure 9, where Figure 9a represents the results for Baltra; Santa Cruz and Figure 9b for San Cristobal.
In this way, the following field recognition discarded seven polygons from the Island San Cristobal and one from Santa Cruz since the terrain, vegetation slope and the difficulties in entering into the areas make them unavailable. On the other hand, five more polygons from San Cristobal were discarded due to property problems with the habitants. In this way, Table 11 shows the calcifications that the polygons received on the field examination.
In this way, the field assessment showed that the best polygons to be considered are 1 and 2 on Baltra Island. These areas have proximity to the airport, which has other wind and photovoltaic projects installed. In this way, the study developed not only confirms that the old projects recover the most profitable energy resources for the island but also shows that these can be improved since the airport is the area with the most tourist traffic as the most energy and fuel consuming area, reinforcing the necessary utilization of alternative energies, hence Figure 10 shows the recommended distribution.
However, the following best locations for the implementation of wind energy are polygons 6, 7, 11 and 16 on San Cristobal, making these areas very interesting to also implement Eolic generators. Furthermore, the field explorations showed natural alterations in the vegetation due to the wind power on the field, as shown in Figure A1 of the Appendix A; hence, these areas are also recommended for the evaluation of the integration of wind power plants.
In this way, the results presented in this research show the potential use of renewable resources for the conservation of natural reserves, where the multicriteria decision methods have been used to assess the implementation of renewable energy plants since they consider multiple conflicting goals [57]. Several studies have used this method and showed that shortcoming implementations can use this kind of research to assess the suitability of the locations and develop related environmental and energetic policies [71], such as the Zero Fossil Fuel in Galápagos initiative. Furthermore, considering the evaluation for future implementation of renewable energies, it extends beyond specific territories and also has an impact on potentially attractive and affordable energy generation [72].

4. Conclusions

The information layers used presented sufficient spatial consistency for the analysis surface in both the wind and the solar power plants analysis. However, this information has been generated in different periods; therefore, in this research, it was assumed that there are no substantial changes in other seasons that affect the validity of the vector and raster models used during this evaluation. Although the final locations were delimited quite precisely, the results of this analysis could be improved and contrasted using better-quality input information. Nevertheless, considering the limitations mentioned, the results showed great concordance with studies that used the same methodologies.
In the case of the solar radiation data obtained from the NREL, there were products with a 5 km × 5 km resolution, so the product had to be re-scaled to fine-tune the results and adjust them to the other criteria considered. These data reflect that the solar potential in the islands ranges between 2 and 6.5 kWh/m2/day; these values can be observed in each pixel of the downloaded product.
The GIS technology has shown to be useful in the identification of relevant data that allowed the implementation of multicriteria decision methods to make the best selection of the locations for wind farms and solar plants. In this sense, the multicriteria evaluation applied in this work provided sufficient results for the delimitation of locations with wind and solar potential, showing in the results that the best locations can be cataloged, and even if the best-suited areas are considered to have a high sensitivity between 85%-89% to the criteria, they are relatively small; there are still the areas considered to have middle sensitivity, such as the area located on Santiago Island. However, for the solar power plants assessment, the areas that can be used for renewable energy plants can provide enough energy to fulfill the needs of the host islands.
The prioritized installable capacity for the islands of Baltra, Santa Cruz, San Cristóbal and Isabela exceeds 30 (MW) in each one, where the prioritization of a maximum of 10.5 (MW) is recommended in the most populated islands so that it does not oversize the generation. In addition, energy storage systems must be available due to the intermittency in the generation of this type of power plant.

Author Contributions

Conceptualization, G.V. and D.J.; methodology, G.V., D.J. and J.M.-G.; software, G.V. and D.J.; validation, G.V., D.J., J.F.N. and J.M.-G.; formal analysis, G.V., D.J., J.F.N., J.M.-G. and F.B.; investigation, G.V., D.J., J.F.N., J.M.-G. and F.B.; resources, F.B.; data curation, G.V. and D.J.; writing—original draft preparation, G.V. and D.J.; writing—review and editing, J.F.N. and J.M.-G.; visualization, G.V. and D.J.; supervision, J.M.-G.; project administration, J.M.-G.; funding acquisition, J.M.-G. All authors have read and agreed to the published version of the manuscript.

Funding

This research was funded by Universidad Internacional SEK, grant number P121819 and The APC was funded by Universidad Internacional SEK.

Acknowledgments

This research takes part in the project selection, characterization, and simulation of phase change materials for thermal comfort, cooling, and energy storage. This project is part of the INEDITA call for R&D research projects in the field of energy and materials. This research takes part in project P121819, Parque de Energias Renovables, founded by Universidad International SEK.

Conflicts of Interest

The authors declare no conflict of interest.

Nomenclature

CIConsistency Index
CRConsistency Ratio
λmaxMaximum Eigenvalue
ZMulticriteria Raster Tensor
RIRandom index
VStandardized Factors
wweights
Abbreviations
AHPAnalytic Hierarchy Process
GISGeographic Information System
MCEMulticriteria Evaluation
MCDMMulticriteria Decision Methods
NRELNational Renewable Energy
OWAOrdered Weighted Average

Appendix A

Figure A1. Endemic vegetation on San Cristobal polygons.
Energies 16 00029 g0a1

References

  1. Zahid, F.; Tahir, A.; Khan, H.U.; Naeem, M.A. Wind farms selection using geospatial technologies and energy generation capacity in Gwadar. Energy Rep. 2021, 7, 5857–5870. [Google Scholar] [CrossRef]
  2. Deveci, M.; Cali, U.; Pamucar, D. Evaluation of criteria for site selection of solar photovoltaic (PV) projects using fuzzy logarithmic additive estimation of weight coefficients. Energy Rep. 2021, 7, 8805–8824. [Google Scholar] [CrossRef]
  3. Zambrano-Asanza, S.; Quiros-Tortos, J.; Franco, J.F. Optimal site selection for photovoltaic power plants using a GIS-based multi-criteria decision making and spatial overlay with electric load. Renew. Sustain. Energy Rev. 2021, 143, 110853. [Google Scholar] [CrossRef]
  4. Sotiropoulou, K.F.; Vavatsikos, A.P. Onshore wind farms GIS-Assisted suitability analysis using PROMETHEE II. Energy Policy 2021, 158, 112531. [Google Scholar] [CrossRef]
  5. Simsek, Y.; Watts, D.; Escobar, R. Sustainability evaluation of Concentrated Solar Power (CSP) projects under Clean Development Mechanism (CDM) by using Multi Criteria Decision Method (MCDM). Renew. Sustain. Energy Rev. 2018, 93, 421–438. [Google Scholar] [CrossRef]
  6. Icaza, D.; Borge-Diez, D.; Galindo, S.P. Proposal of 100% renewable energy production for the City of Cuenca- Ecuador by 2050. Renew. Energy 2021, 170, 1324–1341. [Google Scholar] [CrossRef]
  7. Icaza-Alvarez, D.; Jurado, F.; Tostado-Véliz, M.; Arevalo, P. Decarbonization of the Galapagos Islands. Proposal to transform the energy system into 100% renewable by 2050. Renew. Energy 2022, 189, 199–220. [Google Scholar] [CrossRef]
  8. Urquizo, J.; Singh, P.; Lansdale, D.; Banda, D.; Chen, S.; Henderson, L.; Pierre, K.; Sowe, G.; Guerrero, C.; Jaben, D. Assessing Energy and Communication Needs for the Sustainable and Educational Development of the Inhabitants of the Galapagos Islands. In Proceedings of the 2018 IEEE Global Humanitarian Technology Conference (GHTC), San Jose, CA, USA, 18–21 October 2018; pp. 1–7. [Google Scholar] [CrossRef]
  9. Llerena-Pizarro, O.R.; Micena, R.P.; Tuna, C.E.; Silveira, J.L. Electricity sector in the Galapagos Islands: Current status, renewable sources, and hybrid power generation system proposal. Renew. Sustain. Energy Rev. 2019, 108, 65–75. [Google Scholar] [CrossRef]
  10. Pizzitutti, F.; Walsh, S.J.; Rindfuss, R.R.; Gunter, R.; Quiroga, D.; Tippett, R.; Mena, C.F. Scenario planning for tourism management: A participatory and system dynamics model applied to the Galapagos Islands of Ecuador. J. Sustain. Tour. 2017, 25, 1117–1137. [Google Scholar] [CrossRef]
  11. Eras-Almeida, A.A.; Egido-Aguilera, M.A.; Blechinger, P.; Berendes, S.; Caamaño, E.; García-Alcalde, E. Decarbonizing the Galapagos Islands: Techno-Economic Perspectives for the Hybrid Renewable Mini-Grid Baltra–Santa Cruz. Sustainability 2020, 12, 2282. [Google Scholar] [CrossRef] [Green Version]
  12. Mestanza, C.; Botero, C.M.; Anfuso, G.; Chica-Ruiz, J.A.; Pranzini, E.; Mooser, A. Beach litter in Ecuador and the Galapagos islands: A baseline to enhance environmental conservation and sustainable beach tourism. Mar. Pollut. Bull. 2019, 140, 573–578. [Google Scholar] [CrossRef] [PubMed]
  13. Eras-Almeida, A.A.; Egido-Aguilera, M.A. Hybrid renewable mini-grids on non-interconnected small islands: Review of case studies. Renew. Sustain. Energy Rev. 2019, 116, 109417. [Google Scholar] [CrossRef]
  14. Parra, R.; Cevallos, J.; Quispe, B. Energy independence in the Galapagos Islands. In Proceedings of the BIWAES 2015, Stockholm, Sweden, 4–7 May 2015; pp. 258–265. [Google Scholar]
  15. Benalcazar, P.; Suski, A.; Kamiński, J. Optimal Sizing and Scheduling of Hybrid Energy Systems: The Cases of Morona Santiago and the Galapagos Islands. Energies 2020, 13, 3933. [Google Scholar] [CrossRef]
  16. Morales, D.X.; Besanger, Y.; Bel, C.A.; Medina, R.D. Impact assessment of new services in the Galapagos low voltage network. In Proceedings of the 2016 IEEE PES Transmission Distribution Conference and Exposition-Latin America (PES T D-LA), Morelia, Mexico, 20–24 September 2016; pp. 1–6. [Google Scholar] [CrossRef]
  17. Morales, D.X.; Besanger, Y.; Sami, S.; Alvarez Bel, C. Assessment of the impact of intelligent DSM methods in the Galapagos Islands toward a Smart Grid. Electr. Power Syst. Res. 2017, 146, 308–320. [Google Scholar] [CrossRef]
  18. Ministerio de Energía y Recursos Naturales No Renovables Proyectos de Energias Renovables en Galápagos. 2019. Available online: https://www.recursosyenergia.gob.ec/mas-de-usd-55-millones-se-han-invertido-en-proyectos-de-energia-renovable-a-traves-de-la-iniciativa-cero-combustibles-fosiles-en-galapagos/ (accessed on 31 January 2022).
  19. Arévalo, P.; Tostado-Véliz, M.; Jurado, F. Repowering Feasibility Study of a Current Hybrid Renewable System. Case Study, Galapagos Islands. Electricity 2021, 2, 487–502. [Google Scholar] [CrossRef]
  20. García, J.L.; Jurado, F.; Larco, V. Review and resource assessment, solar energy in different region in Ecuador. E3S Web Conf. 2019, 80, 01003. [Google Scholar] [CrossRef]
  21. Eras-Almeida, A.A.; Egido-Aguilera, M.A. Quality control applied to the photovoltaic systems of the Galapagos Islands: The case of Baltra and Santa Cruz. In Proceedings of the 3rd International Hybrid Power Systems Workshop, Tenerifa, Spain, 8–9 May 2018; p. 250. [Google Scholar]
  22. Cano, A.; Arévalo, P.; Jurado, F. A comparison of sizing methods for a long-term renewable hybrid system. Case study: Galapagos Islands 2031. Sustain. Energy Fuels 2021, 5, 1548–1566. [Google Scholar] [CrossRef]
  23. Kunz, T.H.; Arnett, E.B.; Erickson, W.P.; Hoar, A.R.; Johnson, G.D.; Larkin, R.P.; Strickland, M.D.; Thresher, R.W.; Tuttle, M.D. Ecological impacts of wind energy development on bats: Questions, research needs, and hypotheses. Front. Ecol. Environ. 2007, 5, 315–324. [Google Scholar] [CrossRef]
  24. Eras, A.A.; Coronel, C.B.; Chumbi Movilidad, R.H. Eléctrica para Galápagos: Determinación de Parámetros Técnicos. Rev. Técnica Energía 2017, 13, 213–221. [Google Scholar] [CrossRef]
  25. Herremans, I.M.; Tyler, M.-E. Climate Change Policy as a Catalyst for Sustainable Energy Practice: Examples from Mainland Ecuador and the Galapagos BT. In Sustainable Energy Mix in Fragile Environments: Frameworks and Perspectives; Tyler, M.-E., Ed.; Springer International Publishing: Cham, Switzerland, 2018; pp. 33–47. [Google Scholar]
  26. Arca, D.; Keskin Citiroglu, H. Geographical information systems-based analysis of site selection for wind power plants in Kozlu District (Zonguldak-NW Turkey) by multi-criteria decision analysis method. Energy Sources Part A Recover. Util. Environ. Eff. 2020, 1–13. [Google Scholar] [CrossRef]
  27. De Santoli, L.; Mancini, F.; Astiaso Garcia, D. A GIS-based model to assess electric energy consumptions and usable renewable energy potential in Lazio region at municipality scale. Sustain. Cities Soc. 2019, 46, 101413. [Google Scholar] [CrossRef] [Green Version]
  28. Guaita-Pradas, I.; Marques-Perez, I.; Gallego, A.; Segura, B. Analyzing territory for the sustainable development of solar photovoltaic power using GIS databases. Environ. Monit. Assess. 2019, 191, 764. [Google Scholar] [CrossRef] [PubMed] [Green Version]
  29. Ayalew, L.; Yamagishi, H. The application of GIS-based logistic regression for landslide susceptibility mapping in the Kakuda-Yahiko Mountains, Central Japan. Geomorphology 2005, 65, 15–31. [Google Scholar] [CrossRef]
  30. Amjad, F.; Shah, L.A. Identification and assessment of sites for solar farms development using GIS and density based clustering technique- A case of Pakistan. Renew. Energy 2020, 155, 761–769. [Google Scholar] [CrossRef]
  31. Sánchez-Lozano, J.M.; García-Cascales, M.S.; Lamata, M.T. GIS-based onshore wind farm site selection using Fuzzy Multi-Criteria Decision Making methods. Evaluating the case of Southeastern Spain. Appl. Energy 2016, 171, 86–102. [Google Scholar] [CrossRef]
  32. Doorga, J.R.S.; Rughooputh, S.D.D.V.; Boojhawon, R. Multi-criteria GIS-based modelling technique for identifying potential solar farm sites: A case study in Mauritius. Renew. Energy 2019, 133, 1201–1219. [Google Scholar] [CrossRef]
  33. Shorabeh, S.N.; Firozjaei, M.K.; Nematollahi, O.; Firozjaei, H.K.; Jelokhani-Niaraki, M. A risk-based multi-criteria spatial decision analysis for solar power plant site selection in different climates: A case study in Iran. Renew. Energy 2019, 143, 958–973. [Google Scholar] [CrossRef]
  34. Cevallos-Sierra, J.; Ramos-Martin, J. Spatial assessment of the potential of renewable energy: The case of Ecuador. Renew. Sustain. Energy Rev. 2018, 81, 1154–1165. [Google Scholar] [CrossRef]
  35. Janke Multicriteria, J.R. GIS modeling of wind and solar farms in Colorado. Renew. Energy 2010, 35, 2228–2234. [Google Scholar] [CrossRef]
  36. Khan, I. Power generation expansion plan and sustainability in a developing country: A multi-criteria decision analysis. J. Clean. Prod. 2019, 220, 707–720. [Google Scholar] [CrossRef]
  37. Seddiki, M.; Bennadji, A. Multi-criteria evaluation of renewable energy alternatives for electricity generation in a residential building. Renew. Sustain. Energy Rev. 2019, 110, 101–117. [Google Scholar] [CrossRef]
  38. Villacreses, G.; Martínez-Gómez, J.; Jijón, D.; Cordovez, M. Geolocation of photovoltaic farms using Geographic Information Systems (GIS) with Multiple-criteria decision-making (MCDM) methods: Case of the Ecuadorian energy regulation. Energy Rep. 2022, 8, 3526–3548. [Google Scholar] [CrossRef]
  39. Ozdemir, S.; Sahin, G. Multi-criteria decision-making in the location selection for a solar PV power plant using AHP. Measurement 2018, 129, 218–226. [Google Scholar] [CrossRef]
  40. Watson, J.J.W.; Hudson, M.D. Regional Scale wind farm and solar farm suitability assessment using GIS-assisted multi-criteria evaluation. Landsc. Urban Plan. 2015, 138, 20–31. [Google Scholar] [CrossRef]
  41. Anwarzai, M.A.; Nagasaka, K. Utility-scale implementable potential of wind and solar energies for Afghanistan using GIS multi-criteria decision analysis. Renew. Sustain. Energy Rev. 2017, 71, 150–160. [Google Scholar] [CrossRef]
  42. Mensour, O.N.; el Ghazzani, B.; Hlimi, B.; Ihlal, A. A geographical information system-based multi-criteria method for the evaluation of solar farms locations: A case study in Souss-Massa area, southern Morocco. Energy 2019, 182, 900–919. [Google Scholar] [CrossRef]
  43. Zabihi, H.; Alizadeh, M.; Kibet Langat, P.; Karami, M.; Shahabi, H.; Ahmad, A.; Nor Said, M.; Lee, S. GIS Multi-Criteria Analysis by Ordered Weighted Averaging (OWA): Toward an Integrated Citrus Management Strategy. Sustainability 2019, 11, 1009. [Google Scholar] [CrossRef] [Green Version]
  44. Li, Z. Study of site suitability assessment of regional wind resources development based on multi-criteria decision. Clean Technol. Environ. Policy 2018, 20, 1147–1166. [Google Scholar] [CrossRef]
  45. Al-Yahyai, S.; Charabi, Y.; Gastli, A.; Al-Badi, A. Wind farm land suitability indexing using multi-criteria analysis. Renew. Energy 2012, 44, 80–87. [Google Scholar] [CrossRef]
  46. Shiraishi, K.; Shirley, R.G.; Kammen, D.M. Geospatial multi-criteria analysis for identifying high priority clean energy investment opportunities: A case study on land-use conflict in Bangladesh. Appl. Energy 2019, 235, 1457–1467. [Google Scholar] [CrossRef]
  47. Giamalaki, M.; Tsoutsos, T. Sustainable siting of solar power installations in Mediterranean using a GIS/AHP approach. Renew. Energy 2019, 141, 64–75. [Google Scholar] [CrossRef]
  48. Xu, Y.; Li, Y.; Zheng, L.; Cui, L.; Li, S.; Li, W.; Cai, Y. Site selection of wind farms using GIS and multi-criteria decision making method in Wafangdian, China. Energy 2020, 207, 118222. [Google Scholar] [CrossRef]
  49. Koc, A.; Turk, S.; Şahin, G. Multi-criteria of wind-solar site selection problem using a GIS-AHP-based approach with an application in Igdir Province/Turkey. Environ. Sci. Pollut. Res. 2019, 26, 32298–32310. [Google Scholar] [CrossRef] [PubMed]
  50. Ghaffari Gilandeh, A.; Sobhani, B.; Ostadi, E. Combining Arc-GIS and OWA model in flooding potential analysis (case study: Meshkinshahr city). Nat. Hazards 2020, 102, 1435–1449. [Google Scholar] [CrossRef]
  51. Malczewski, J. Integrating multicriteria analysis and geographic information systems: The ordered weighted averaging (OWA) approach. Int. J. Environ. Technol. Manag. 2005, 6, 7–19. [Google Scholar] [CrossRef]
  52. Al Garni, H.Z.; Awasthi, A. Solar PV power plant site selection using a GIS-AHP based approach with application in Saudi Arabia. Appl. Energy 2017, 206, 1225–1240. [Google Scholar] [CrossRef]
  53. Mahdy, M.; Bahaj, A.B.S. Multi criteria decision analysis for offshore wind energy potential in Egypt. Renew. Energy 2018, 118, 278–289. [Google Scholar] [CrossRef]
  54. Villacreses, G.; Gaona, G.; Martínez-Gómez, J.; Jijón, D.J. Wind farms suitability location using geographical information system (GIS), based on multi-criteria decision making (MCDM) methods: The case of continental Ecuador. Renew. Energy 2017, 109, 275–286. [Google Scholar] [CrossRef]
  55. Ali, S.; Taweekun, J.; Techato, K.; Waewsak, J.; Gyawali, S. GIS based site suitability assessment for wind and solar farms in Songkhla, Thailand. Renew. Energy 2019, 132, 1360–1372. [Google Scholar] [CrossRef]
  56. Elkadeem, M.R.; Younes, A.; Sharshir, S.W.; Campana, P.E.; Wang, S. Sustainable siting and design optimization of hybrid renewable energy system: A geospatial multi-criteria analysis. Appl. Energy 2021, 295, 117071. [Google Scholar] [CrossRef]
  57. Shao, M.; Han, Z.; Sun, J.; Xiao, C.; Zhang, S.; Zhao, Y. A review of multi-criteria decision making applications for renewable energy site selection. Renew. Energy 2020, 157, 377–403. [Google Scholar] [CrossRef]
  58. Siksnelyte, I.; Zavadskas, E.K.; Streimikiene, D.; Sharma, D. An Overview of Multi-Criteria Decision-Making Methods in Dealing with Sustainable Energy Development Issues. Energies 2018, 11, 2754. [Google Scholar] [CrossRef] [Green Version]
  59. Alami Merrouni, A.; Elwali Elalaoui, F.; Mezrhab, A.; Mezrhab, A.; Ghennioui, A. Large scale PV sites selection by combining GIS and Analytical Hierarchy Process. Case study: Eastern Morocco. Renew. Energy 2018, 119, 863–873. [Google Scholar] [CrossRef]
  60. Ibrahim, G.R.F.; Hamid, A.A.; Darwesh, U.M.; Rasul, A. A GIS-based Boolean logic-analytical hierarchy process for solar power plant (case study: Erbil Governorate—Iraq). Environ. Dev. Sustain. 2021, 23, 6066–6083. [Google Scholar] [CrossRef]
  61. Rios, R.; Duarte, S. Selection of ideal sites for the development of large-scale solar photovoltaic projects through Analytical Hierarchical Process—Geographic information systems (AHP-GIS) in Peru. Renew. Sustain. Energy Rev. 2021, 149, 111310. [Google Scholar] [CrossRef]
  62. Odu, G.O. Weighting methods for multi-criteria decision making technique. J. Appl. Sci. Environ. Manag. 2019, 23, 1449. [Google Scholar] [CrossRef] [Green Version]
  63. Nicolalde, J.F.; Cabrera, M.; Martínez-Gómez, J.; Salazar, R.B.; Reyes, E. Selection of a PCM for a Vehicle’s Rooftop by Multicriteria Decision Methods and Simulation. Appl. Sci. 2021, 11, 6359. [Google Scholar] [CrossRef]
  64. Firozjaei, M.K.; Nematollahi, O.; Mijani, N.; Shorabeh, S.N.; Firozjaei, H.K.; Toomanian, A. An integrated GIS-based Ordered Weighted Averaging analysis for solar energy evaluation in Iran: Current conditions and future planning. Renew. Energy 2019, 136, 1130–1146. [Google Scholar] [CrossRef]
  65. Mokarram, M.; Hojati, M. Using ordered weight averaging (OWA) aggregation for multi-criteria soil fertility evaluation by GIS (case study: Southeast Iran). Comput. Electron. Agric. 2017, 132, 1–13. [Google Scholar] [CrossRef]
  66. Ministerio de Energía. Guía de Evaluación Inicial de Edificios para la Instalación de Sistemas Fotovoltaicos. Gobierno de Chile, p. 39 2016. Available online: https://techossolares.minenergia.cl/wp-content/uploads/2017/04/Guia-de-evaluacion-inicial-de-edificios.pdf (accessed on 1 January 2020).
  67. Ministerio de Electricidad y Energías Renovables (MEER). Atlas Eólico del Ecuador: Con Fines de Generación Eléctrica; Gobierno Nacional del Ecuador: Quito, Ecuador, 2013.
  68. Jijón, D.; Constante, J.; Villacreses, G.; Guerrero, T. Estimación del rendimiento de aerogeneradores de 2 MW en el Ecuador: Potencial Eolo-Eléctrico. Rev. Técnica Energía 2018, 15, 62–69. [Google Scholar] [CrossRef]
  69. Gavériaux, L.; Laverrière, G.; Wang, T.; Maslov, N.; Claramunt, C. GIS-based multi-criteria analysis for offshore wind turbine deployment in Hong Kong. Ann. GIS 2019, 25, 207–218. [Google Scholar] [CrossRef]
  70. Tercan, E.; Eymen, A.; Urfalı, T.; Saracoglu, B.O. A sustainable framework for spatial planning of photovoltaic solar farms using GIS and multi-criteria assessment approach in Central Anatolia, Turkey. Land Use Policy 2021, 102, 105272. [Google Scholar] [CrossRef]
  71. Saraswat, S.K.; Digalwar, A.K.; Yadav, S.S.; Kumar, G. MCDM and GIS based modelling technique for assessment of solar and wind farm locations in India. Renew. Energy 2021, 169, 865–884. [Google Scholar] [CrossRef]
  72. Elkadeem, M.R.; Younes, A.; Mazzeo, D.; Jurasz, J.; Campana, P.E.; Sharshir, S.W.; Alaam, M.A. Geospatial-assisted multi-criterion analysis of solar and wind power geographical-technical-economic potential assessment. Appl. Energy 2022, 322, 119532. [Google Scholar] [CrossRef]
Figure 1. Logistic functions.
Energies 16 00029 g001
Figure 2. Layer preparation for MCDM on wind farms. (A) wind speed (B) Terrain slope (C) Distance to urban areas. (D) substations distance. (E) Distance to the road network. (F) restricted/empty areas.
Energies 16 00029 g002
Figure 3. Layer preparation for MCDM on solar plants. (A) Global solar radiation. (B) Terrain slope (C) Distance to urban areas. (D) substations distance. (E) Distance to the road network. (F) restricted/empty areas.
Energies 16 00029 g003
Figure 4. Multicriteria Evaluation for location selection of wind energy.
Energies 16 00029 g004
Figure 5. Suitable locations for wind farm projects.
Energies 16 00029 g005
Figure 6. Multicriteria Evaluation for photovoltaic energy location.
Energies 16 00029 g006
Figure 7. Suitable locations for photovoltaic projects.
Energies 16 00029 g007
Figure 8. Photovoltaic capacity.
Energies 16 00029 g008
Figure 9. Priority Polygons for wind farms. (a) results for Baltra and Santa Cruz; (b) Results for San Cristobal.
Energies 16 00029 g009
Figure 10. Polygons 1 and 2 on Baltra Island.
Energies 16 00029 g010
Table 1. Criteria selection.
Information LayerInstitutionYearType of Criterion
Wind speedMinistry of Electricity and Renewable Energies 2013Factor
Zones with wind speed lower than 5 ms−1Ministry of Electricity and Renewable Energies2013Restriction
Global solar radiationNational Renewable Energy Laboratory (NREL)2016Factor
Elevation digital modelMinistry of electricity and renewable energies2013Factor
SubstationsAgency of Regulation and Electricity Control2016Factor
Road networkGalápagos National Park2015Factor
Urban zonesGalápagos National Park2013Factor/Restriction
LagoonsGalápagos National Park2013Restriction
Volcanic HazardsGalápagos National Park2013Restriction
Mangrove swampGalápagos National Park2013Restriction
Table 2. Processes applied to wind farm information layers.
Information LayerRasterization–Wind FarmRasterization–Solar Plant
Wind speed: 80 mNon-transformation-
Zones with wind speed lower than 5 ms−1Transformation to binary raster-
Global solar radiation-Coverage was downloaded from the NREL, which has a resolution of 5 km × 5 km and for this analysis, the product was re-scaled to 200 m × 200 m, this product matches its pixel dimensions with the other coverages considered in the analysis. This process is also part of the standardization of criteria.
Elevation digital modelSlope calculations
Substation localization pointEuclidean distance calculation to substation
Road networkEuclidean distance calculation to the main road
Urban zonesEuclidean distance calculation to urban zones
Urban zonesTransformation to binary raster
LagoonsTransformation to binary raster
Volcanic HazardsTransformation to binary raster
Mangrove swampTransformation to binary raster
Table 3. Functions applied to re-scaled variables.
VariableType of Logical Function
Wind speedLogistic growth: The higher the wind speed, the higher the rating
Global solar radiationLogistic growth: The higher the global solar radiation, the higher the rating
SlopeLogistic decrease: The lower the slope, the higher the rating
Substation distanceLogistic decrease: The closer to a substation, the higher the rating
Road network distanceLogistical decrease: The closer to the road network, the higher the rating
Urban zone distanceLogistical growth: The farther away from urban areas, the higher the rating.
Table 4. Saaty importance scale.
ImportanceDefinition
1Equally important
3Moderate importance
5Strongly more important
7Very strong more important
9Extremely more important
2,4,6,8Intermediate values
Table 5. The subjective weighting of variables.
VariablesABCDE
A110.330.250.5
B1110.250.5
C31111
D44112
E2210.51
Summation1194.3335
Table 6. Photovoltaic capacity reference.
Installation Area(m2)Capacity(kW)
945
18910
37220
91050
1803100
29,0001500
Table 7. AHP normalization matrix.
Normalization
0.0910.1110.0760.0830.100
0.0910.1110.2310.0830.100
0.2730.1110.2310.3330.200
0.3640.4440.2310.3330.400
0.1820.2220.2310.1670.200
Table 8. Criteria weights.
Weights
A: Wind speed/Global solar radiation0.092
B: Terrain slope0.123
C: Distance to urban areas0.230
D: substations distance0.354
E: Distance to the road network0.200
Table 9. Priority matrix.
MxWR/W
0.485.20
0.635.14
1.185.16
1.855.21
1.045.18
λmax5.18
Table 10. Consistency values.
IndexValue
CI0.045
RI1.12
CR0.04
Table 11. Field exploration assessment.
IslandBaltra and Santa CruzSan Cristobal
Polygon1256745671116
Vegetation101000106101010108
Terrain1010008477867
Wind speed89548889887
Performance factor89548889876
Roads88101040105.57710
Ground107553708797
Bird transit78285128888
Communication1010101010101010101010
Total7171374156445566.5666563
Disclaimer/Publisher’s Note: The statements, opinions and data contained in all publications are solely those of the individual author(s) and contributor(s) and not of MDPI and/or the editor(s). MDPI and/or the editor(s) disclaim responsibility for any injury to people or property re-sulting from any ideas, methods, instructions or products referred to in the content.

